new FFT Filter setup and review web tool

@iampete Fantastic work!
I will definitely be using this extensively.
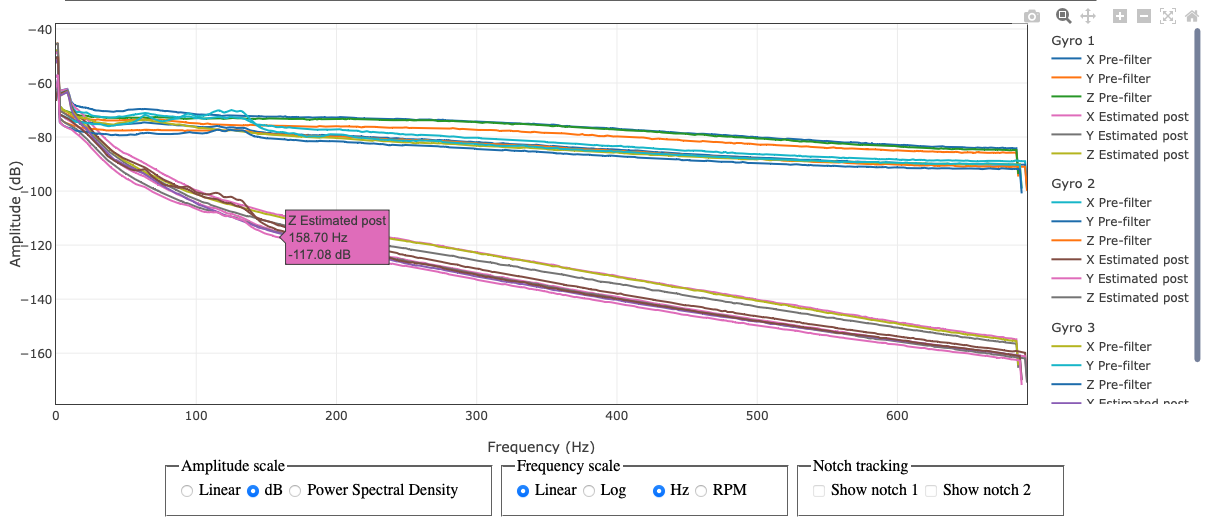
I’ve been testing it out on a couple of logs with a spread of frequencies that dont quite make sense and this has really helped to simplify and better target the HNOTCH settings.

I would point out this is not for the feint hearted or first-time user - you have to know your harmonic notch filter settings and what to look for - but it sure cuts down on the number of test flights.

@iampete Updates
Browser: Firefox 114.0.1 (64-bit), Win11 - Update2, flight data section works OK in Chrome.
I havent been able to get this (in general) to work with older logs, even around copter 4.2 (and maybe even earlier 4.3) but I’ll see if I can find more logs to test - selecting the log to load doesn’t produce any outcome or CPU load - I’m watching the CPU graph to tell when processing is underway or finished.
I havent seen the attitude/throttle graph populated yet, although that is not very important.

2 Likes

I don’t know if this helps at all @iampete - but I flew this today on my “no GPS” test vehicle. I turned on raw IMU logging and ran it through the tool. It looks pretty clean. If you have any thoughts about tuning, I’d appreciate it.
This is the log: Dropbox - 00000120.BIN - Simplify your life
And here is what the tool shows:


1 Like

I’ve had a verified win with the Filter Review Tool ! (well it’s someone else’s copter, not mine…)

As mentioned in the linked discussion, I dont think I would have been able to predict the required HNOTCH settings using the MissionPlanner FFT graphs alone. I probably would never have tried the frequency that was actually required, and would have resigned myself to thinking the “old way” was as good as it was going to get, with some noise remaining, not so effectively filtered.

I’m still waiting to hear back from another person where I used the Filter Review Tool to improve their rather ineffective HNOTCH settings.

I changed to using Chrome with the filter tool, Firefox just wasn’t working properly. There is still a few minor display or usability issues - but nothing that affects the results. For example clicking on a pre-filter heading (like Pete does in the video) doesn’t select all X Y Z check boxes. I still have to click each individual X Y Z for the pre/post/estimate graphs I want.

3 Likes

Great, glad to hear is useful!

Sorry, I miss spoke in the vid, you have to double click the headings.

To be honest I have only ever tried it with chrome. Optimizations for different browsers is well outside my expertise.

1 Like

Brave works fine.

1 Like

2nd win!
I was struggling to get much improvement with the old way of eye-balling the MP graphs and trying to guess at the HNOTCH settings. There was always a mess of frequencies and noise even in the post-filter.
Now it’s clean, and I’m sure this lack of noise almost makes PIDs less prone to oscillations and odd behaviour.

Pre
image

Post
image

2 Likes

That’s a major difference! Was it a case of trial and error in the filter tool until the post-filter estimate looked good?

1 Like

Somewhat, yes - there’s not much trial and error when you can so easily see the effect of changes :slight_smile:

Note that in the Filter Review Tool the tendency is to try and set INS_HNTCH_HMNCS so that every significant peak is covered by a notch, and you end up with a value like 47 , yet in reality a value of 7 usually does the job and all those extra harmonics disappear anyway.

2 Likes

need help deciphering filter settings for this log

62inch propeller and u15xxl motor from tmotor

1 Like

I couldnt load the log in the filter review tool, it’s too big - at least for the FFT tools
Have you got a smaller log?

The only useful thing I could do was extract parameters, and normal log review.
You’ve got default Rate PIDs, you could probably try lower judging by the attitude control

ATC_RAT_PIT_D,0.0025
ATC_RAT_PIT_I,0.100
ATC_RAT_PIT_P,0.100
ATC_RAT_RLL_D,0.0025
ATC_RAT_RLL_I,0.100
ATC_RAT_RLL_P,0.100

In you log bitmask, add PID to logging.

FFT has likely picked up on a harmonic instead of the base frequency:

FFT_BW_HOVER,36.95223
FFT_FREQ_HOVER,131.4387

Probably about double what the real base frequency would be. So you would need to change to
FFT_MINHZ,15
guessing a bit, but it was 25

I think these are reversed:

INS_ACCEL_FILTER,20  //  should be 10
INS_GYRO_FILTER,10   //  should be 20

If that was a short flight then you would have to disable the IMU RAW logging and just use:

INS_LOG_BAT_MASK,1   //  or 3 or 7
INS_LOG_BAT_OPT,4

The other things to note are:

  • no battery failsafe actions
  • no geofence
  • no Motor Emergency Stop RC channel assignment

If you’ve seen what damage a 30inch CF prop can do, you wouldnt stand within a mile of this thing without every possible safety feature in place (and then some).

2 Likes

It loads for me, but as you say its very big. Peak memory usage of about 3.7 GB. I’m not really sure how much we can do about this, we could give the option to not load all the IMUs that are in the log.

I have seen logs that give a out of memory error, I’m not sure if that is a hard coded limit that is the same for every browser/device or if it depends on how much memory you actually have free.

Mostly were using memory to save time, for example on first load we run the FFT over the whole log then if you change your analysis time it just re-averages the original FFT over the new time period. That means we have to keep all the FFT data in memory. We could throw away that data and recalculate each time, this would save a bunch of memory but mean that re-plotting takes just as long as the first load.

1 Like

I have just pushed some updates, should be quite a bit faster.

1 Like

I think the loading problem and “Aw Snap” is the amount of RAM I have at the moment, only 8GB - I can see memory usage climb while loading the log, and then it stops.
Not much chance of getting this to work on the old Sinclair ZX81 with only 1K RAM :laughing:

image

2 Likes

I have been reading up a little. It seems that no matter the amount of actual RAM you have chrome limits each tab to 4GB, so even if the machine has plenty left you can still run out. Your results may vary with other browsers.

I will see what I can do to save some, but I guess there will always be logs that are just too big.

1 Like

It’s probably the amount of physical ram I have. Firefox is actually working OK except for a few missing graphs.

EDIT - feature request :slight_smile:
Another Calculate button near the “Filter Configuration” would be nice

1 Like

@MindProbe
Suggesting some Filter settings - these are very experimental due to the size of your props and considering what are normal guidelines are.

INS_ACCEL_FILTER,10
INS_GYRO_FILTER,7    //  extremely low!
INS_HNTCH_ENABLE,1   //  set this then refresh params to see the rest
INS_HNTCH_MODE,1
INS_HNTCH_REF,0.12
INS_HNTCH_FREQ,9    //  also very low!
INS_HNTCH_BW,4
INS_HNTCH_FM_RAT,0.7
INS_HNTCH_HMNCS,3

These work well enough in theory, but may be too low and cause instability. I’ve tried to balance out filtering noise versus the phase and whatever else I can see onscreen or think of.
I would be more confident if we heard a recommendation from @Leonardthall in case he says my suggested settings would be disastrous. 62inch props are outside of just about everyones comfort zone.

1 Like

Now with handy new button.Should also be faster and use less memory.

We could add a “auto re-calc” checkbox, if the log is not too big then it will update in less than a second, it was this way to start with but got very painful to change several filter parameters, were much faster now so its not quite so bad.

2 Likes

Thanks Pete - great work!

1 Like

Oh, I like this… lots :slight_smile:

1 Like

I’ve tried these settings with not much improvement

I’ve also made a separate thread with the recent logs

1 Like