It has been a goal of mine to find a better way to tune helicopters. I spent almost two years developing the traditional helicopter autotune flight mode. It is far from perfect but gives users the tools to tune their helicopters. TradHeli autotune uses a frequency domain approach in which it determines the max allowable control gains (i.e. rate P or rate D) but still uses an incremental approach to increasing the gains until the tuning criteria are met. This is very similar to the multirotor autotune except it uses a time domain approach. These all use incremental steps and measure the response to determine the level of tune. This requires several flights for tuning and risk to the aircraft.
Control theory of linear systems offers a technique to be able to tune systems through analytical means. This requires the frequency response of the bare airframe dynamics which can be determined from a system ID mode flight. Once the bare airframe frequency response is obtained, the control laws are applied analytically to provide a closed loop frequency response to determine the quality of the tune. The quality of the tune can be evaluated at several levels: rate controller, attitude controller, and pilot input (includes the command model feel characteristics). Other predictions include the attitude disturbance response and stability margins for rate, attitude and entire control system.
The web tool is still under development but I think it has matured enough for users to benefit from it. It can be found here
Theory
This technique assumes the aircraft with the control system is a linear system. Control elements that cause discontinuities like acceleration and rate limits cannot be handled by this technique. Thus it is important to keep the rates and accelerations small. Changes in the control gains like use of the slew rate limiter where it was actively changing the gain during the frequency sweep would also cause problems for this technique. The frequency responses determined are most valid for the condition for which they were gathered (i.e. hover or 10 m/s forward flight). In most cases, the aircraft is tuned for hover conditions but the aircraft characteristics change through out the flight envelope. so be cautious in using the tune determined in a hover for other flight conditions. A simple control system is shown below to explain the method for analytically determining the closed loop frequency response.
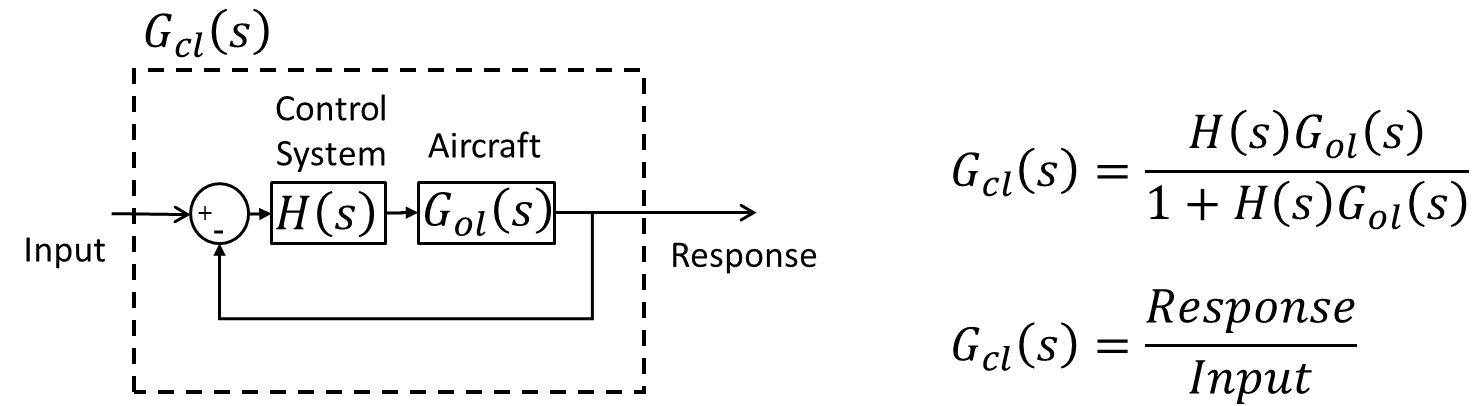
The closed loop system shown in the dashed box can be described in the frequency domain by a frequency response. The frequency response shows the relationship of the aircraft response to the input in both amplitude and phase across a range of frequencies and is calculated from the system ID mode data. The frequency response of the Aircraft alone (i.e bare airframe), shown as a block in the closed loop system, can also be determined from the system ID mode data. Once the bare airframe frequency response is known, the equation for the closed loop system can be used to determine or predict the frequency response of the closed loop system. Thus, control gains, like rate P or rate D, can be changed and the predicted frequency response will show how the closed loop system response will change allowing the user to tune the aircraft response without repeatedly changing the control gains in flight and evaluating the aircraft response. It can all be done on the computer. The final tune can then be checked by conducting another system ID mode flight to verify the desired tune was obtained.
Here is the block diagram of the arducopter control laws for the roll axis.

Each of the blocks represents a transfer function of the associated Notch filter, Low pass filter or Control algorithm. The expressions for each of the closed loop systems is given below
Rate Controller

Attitude Controller

Complete Controller including pilot feel

Gathering the Data to Use the Analytic Tune Web Tool
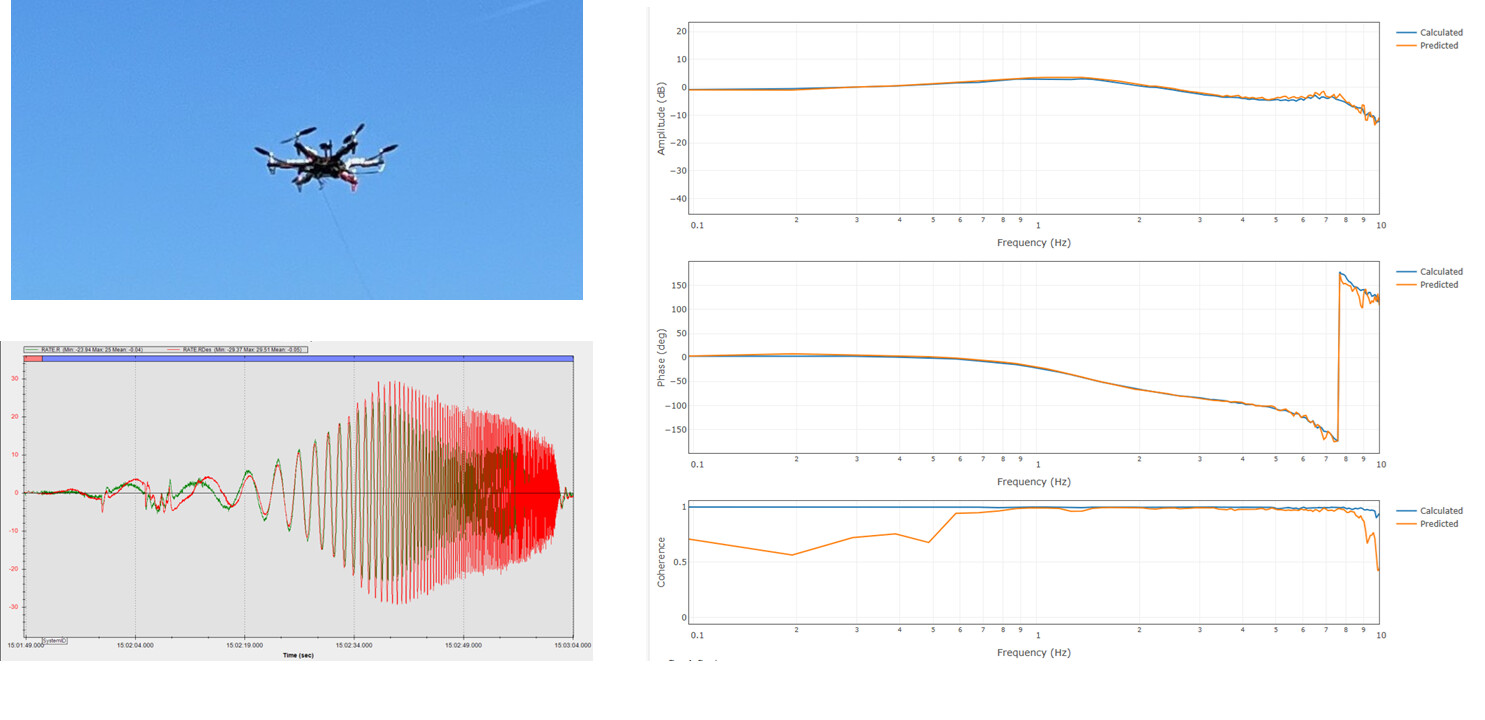
In order to start tuning your multirotor or helicopter using the analytic tune web tool, a frequency sweep needs to be collected using the System ID mode. Follow the instructions for setting up the mode parameters. You can use SID_AXIS values of 1 through 6 to gather the data however it is recommended that SID_AXIS values of 4 (recovery roll), 5 (recovery pitch), or 6 (recover yaw) be used. If you are concerned with high accelerations or rates of the vehicle that may cause damage, then you can use SID_AXIS values of 1 - 3. The SID_MAGNITUDE should be no higher than 5 deg for pitch or roll and 5 deg/s for yaw.
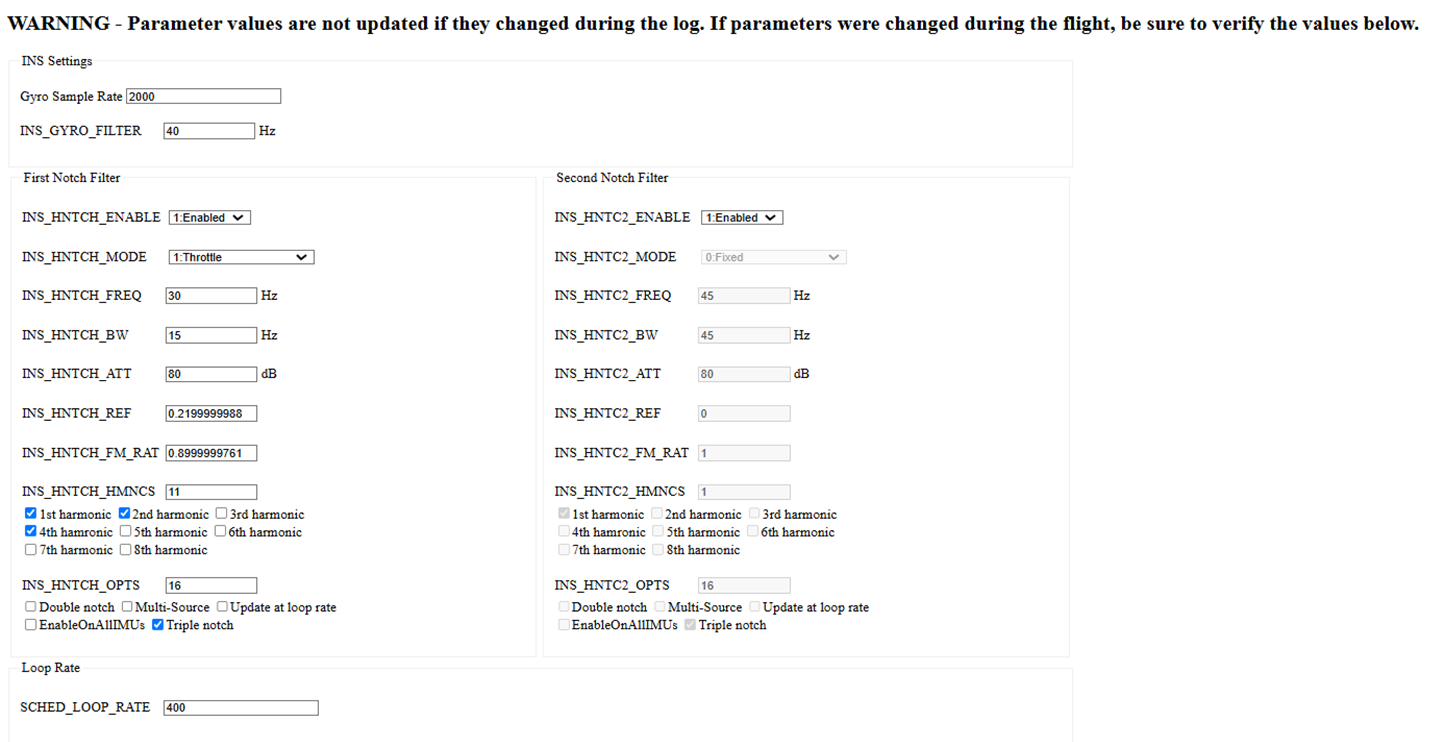
Before conducting the sweep using the System ID mode, be sure that all of the INS notch filters and low pass filters are set. The tool does allow you to explore different settings but it is important to set these properly to remove the noise from the control signals to obtain the best tune.
Using the Web Tool
Loading the Log File
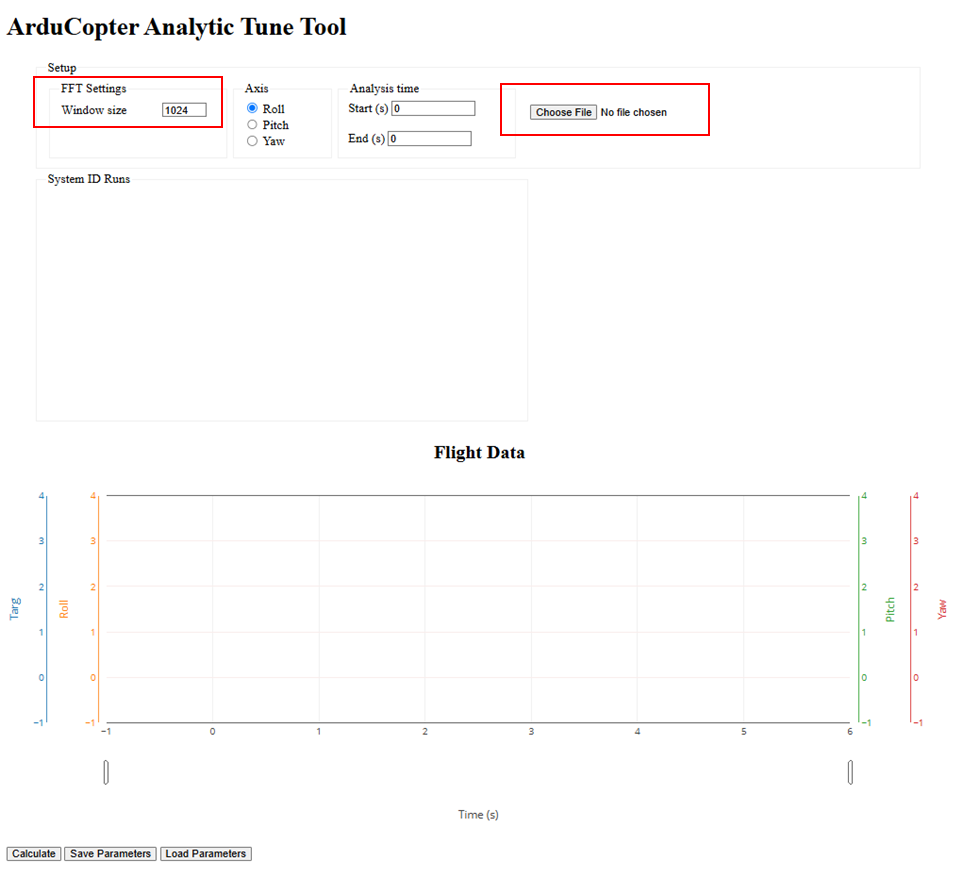
To start using the web tool, you will load the log file and set the Fast Fourier Transform (FFT) window size, highlighted by the red boxes. For a sample rate of 100hz, a window size of 1024 works well.
Selecting System ID Run and Initiating the Analytical Tune
After the log file is loaded, the first system ID run is shown in the time history window with it highlighted in the time history of the entire log. A table of all of the System ID runs (highlighted in red) is provided and the user can select the run they want to use. The axis of the System ID run and the time range is automatically populated. After the run is selected, click Calculate (highlighted in red) to begin analytical tuning.

Parameters
Parameters are automatically loaded from the log file. Only the attitude controller parameters for the axis being tuned are loaded. Parameters can be loaded from a *.param file using the Load Parameter button. Once the analytic tune is completed, the parameters can be saved using the Save Parameters button and then loaded onto the aircraft for testing.

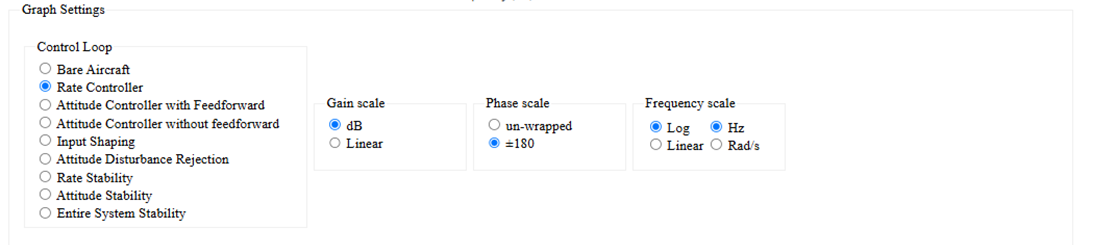
Frequency Responses Available for Tuning
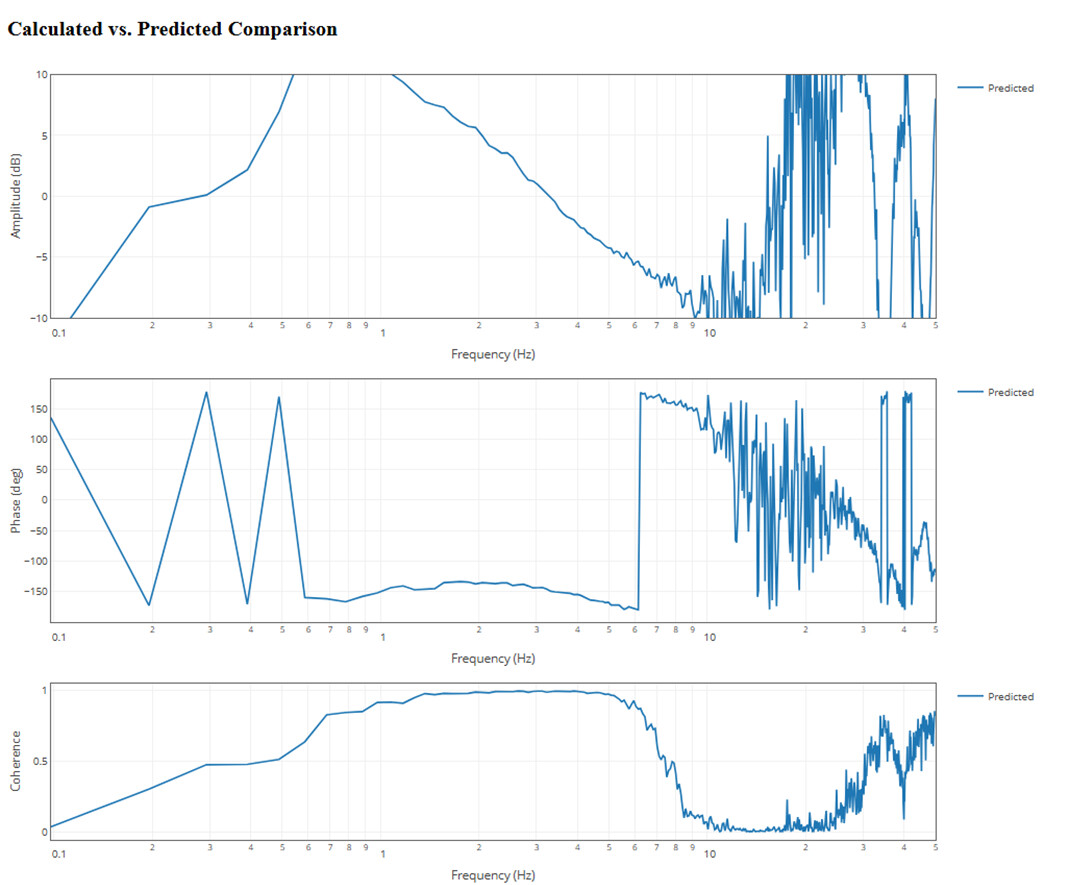
The list of graphs available to use for analytically tuning the aircraft are shown below. Where data is available from the System ID run, a calculated frequency response is shown. Otherwise, the predicted frequency response uses the parameters set on the page to predict the frequency response.
Bare Aircraft
The bare aircraft frequency response shows the dynamics of the aircraft alone as determined by the frequency response of the motors class input to the aircraft response.
Roll: RATE.ROut → SIDD.Gx
Pitch: RATE.POut → SIDD.Gy
Yaw: RATE.YOut → SIDD.Gz
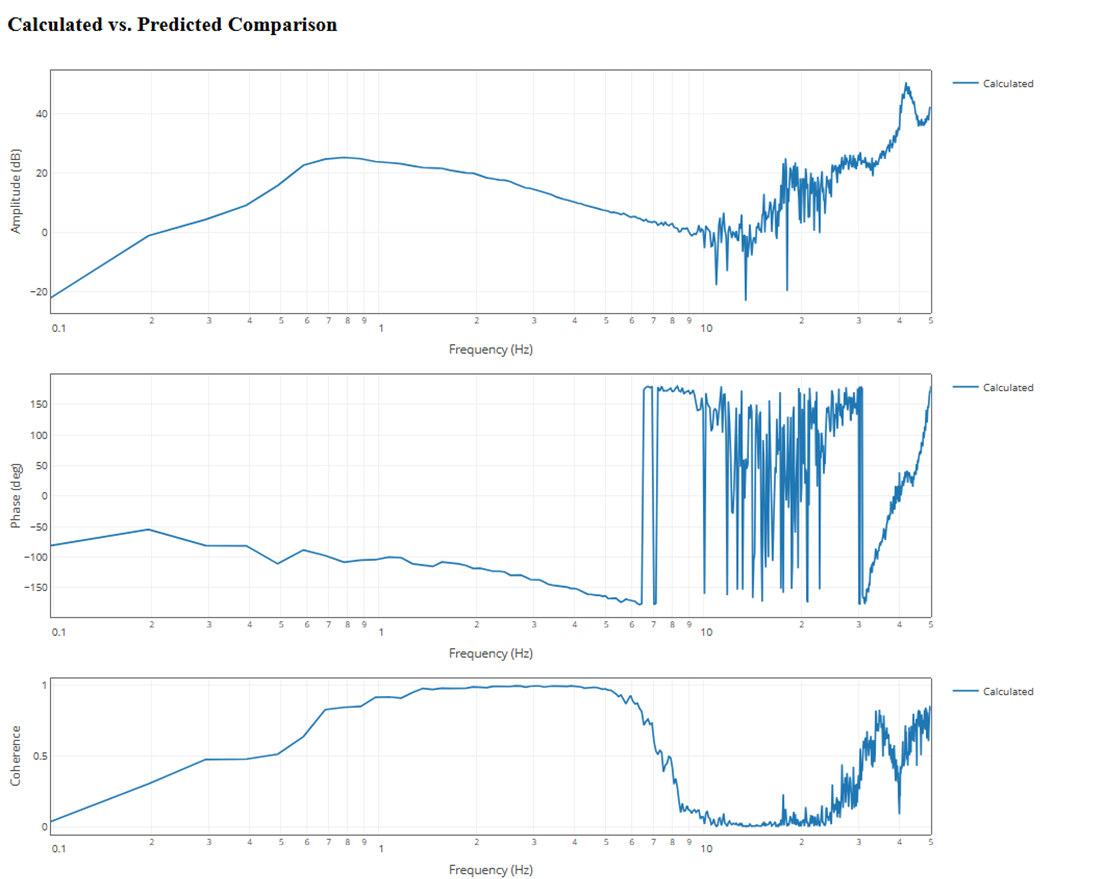
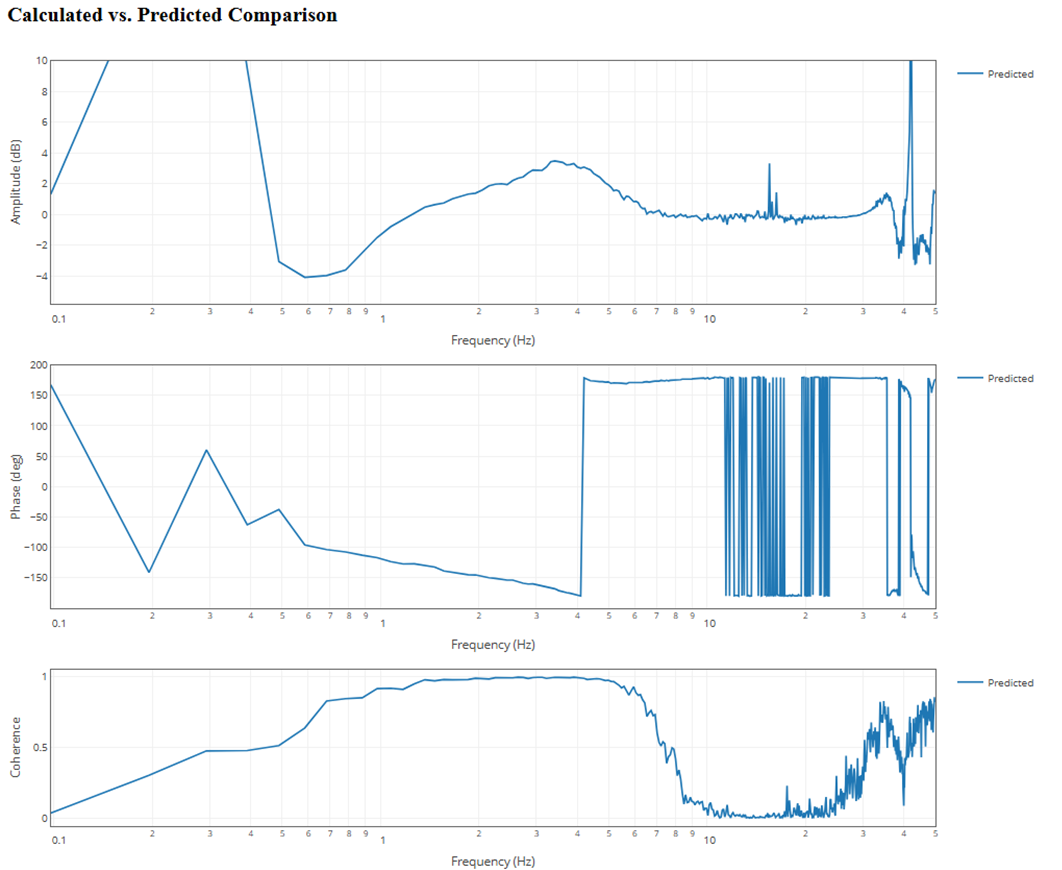
Rate Controller
This plot is used to tune the rate controller PIDs and adjust PID low pass and notch filters.

Attitude Controller with Feedforward
This plot is used to tune the attitude controller P gain and tune the target low pass and notch filters.

Attitude Controller without Feedforward
This plot provides the frequency response of the attitude controller without the feedforward enabled. In this case, the calculated frequency response is not shown as the data was collected with the feedforward enabled.

Input Shaping
This plot shows the effects of the input shaping (feel) on the aircraft response. This is what the pilot would experience when making inputs. This response is used to tune the ATC_INPUT_TC for pitch and roll axes and the PILOT_Y_RATE_TC for the yaw axis. Differences between the calculated and predicted (shown below) when using the log parameters would most likely be caused by acceleration or rate limits.

Attitude Disturbance Rejection
This plot shows how well the attitude control loops can reject attitude disturbances. It is primarily used to determine attitude disturbance rejection bandwidth which is determined as the frequency at the -3 db crossing. The calculated frequency response is only determined for System ID runs where SID_AXIS is 4, 5 or 6.
Stability Plots
The Rate, Attitude and Entire System Stability plots are used to determine Stability margins in the respective control loop. The rate stability plot shows the stability of the rate controller. The attitude stability plot shows the stability of the attitude controller without feedforward enabled. The entire system plot shows the stability of the attitude controller with the feedforward enabled.