The latest Maverick release adds a web based mavlink/dataflash log analysis tool.
Drop any bin or text dataflash log file into ~/data/mavlink/inbox and it will be automatically picked up and imported into a nanosecond resolution time-series database (InfluxDB), and a set of links added to the web dashboard (Grafana)
Use mavlink-router as your mavlink proxy, and set LOG_BACKEND_TYPE to 3 in your flight controller (or SITL) firmware. This automatically saves dataflash bin logs into ~/data/mavlink/fc (or ~/data/mavlink/sitl), and as soon as you disarm the logfile will be automatically imported into InfluxDB and a set of links added to the web dashboard
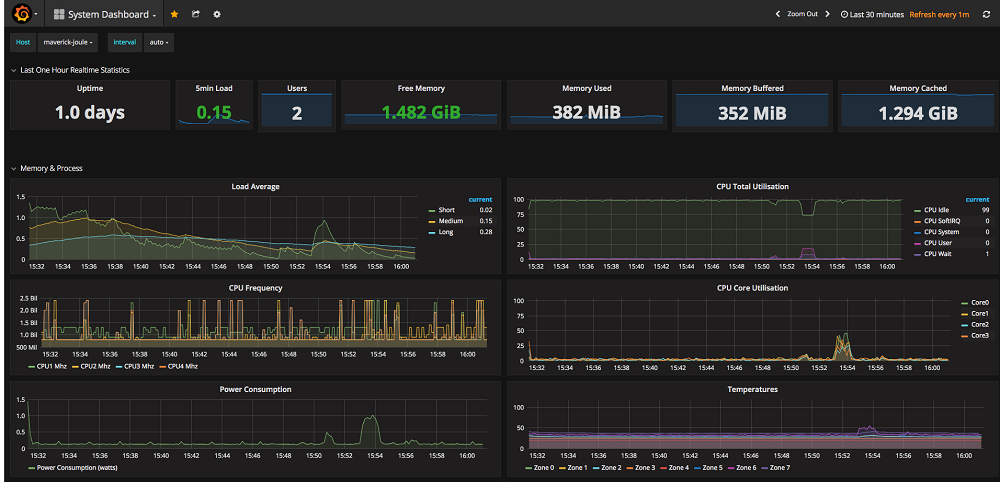
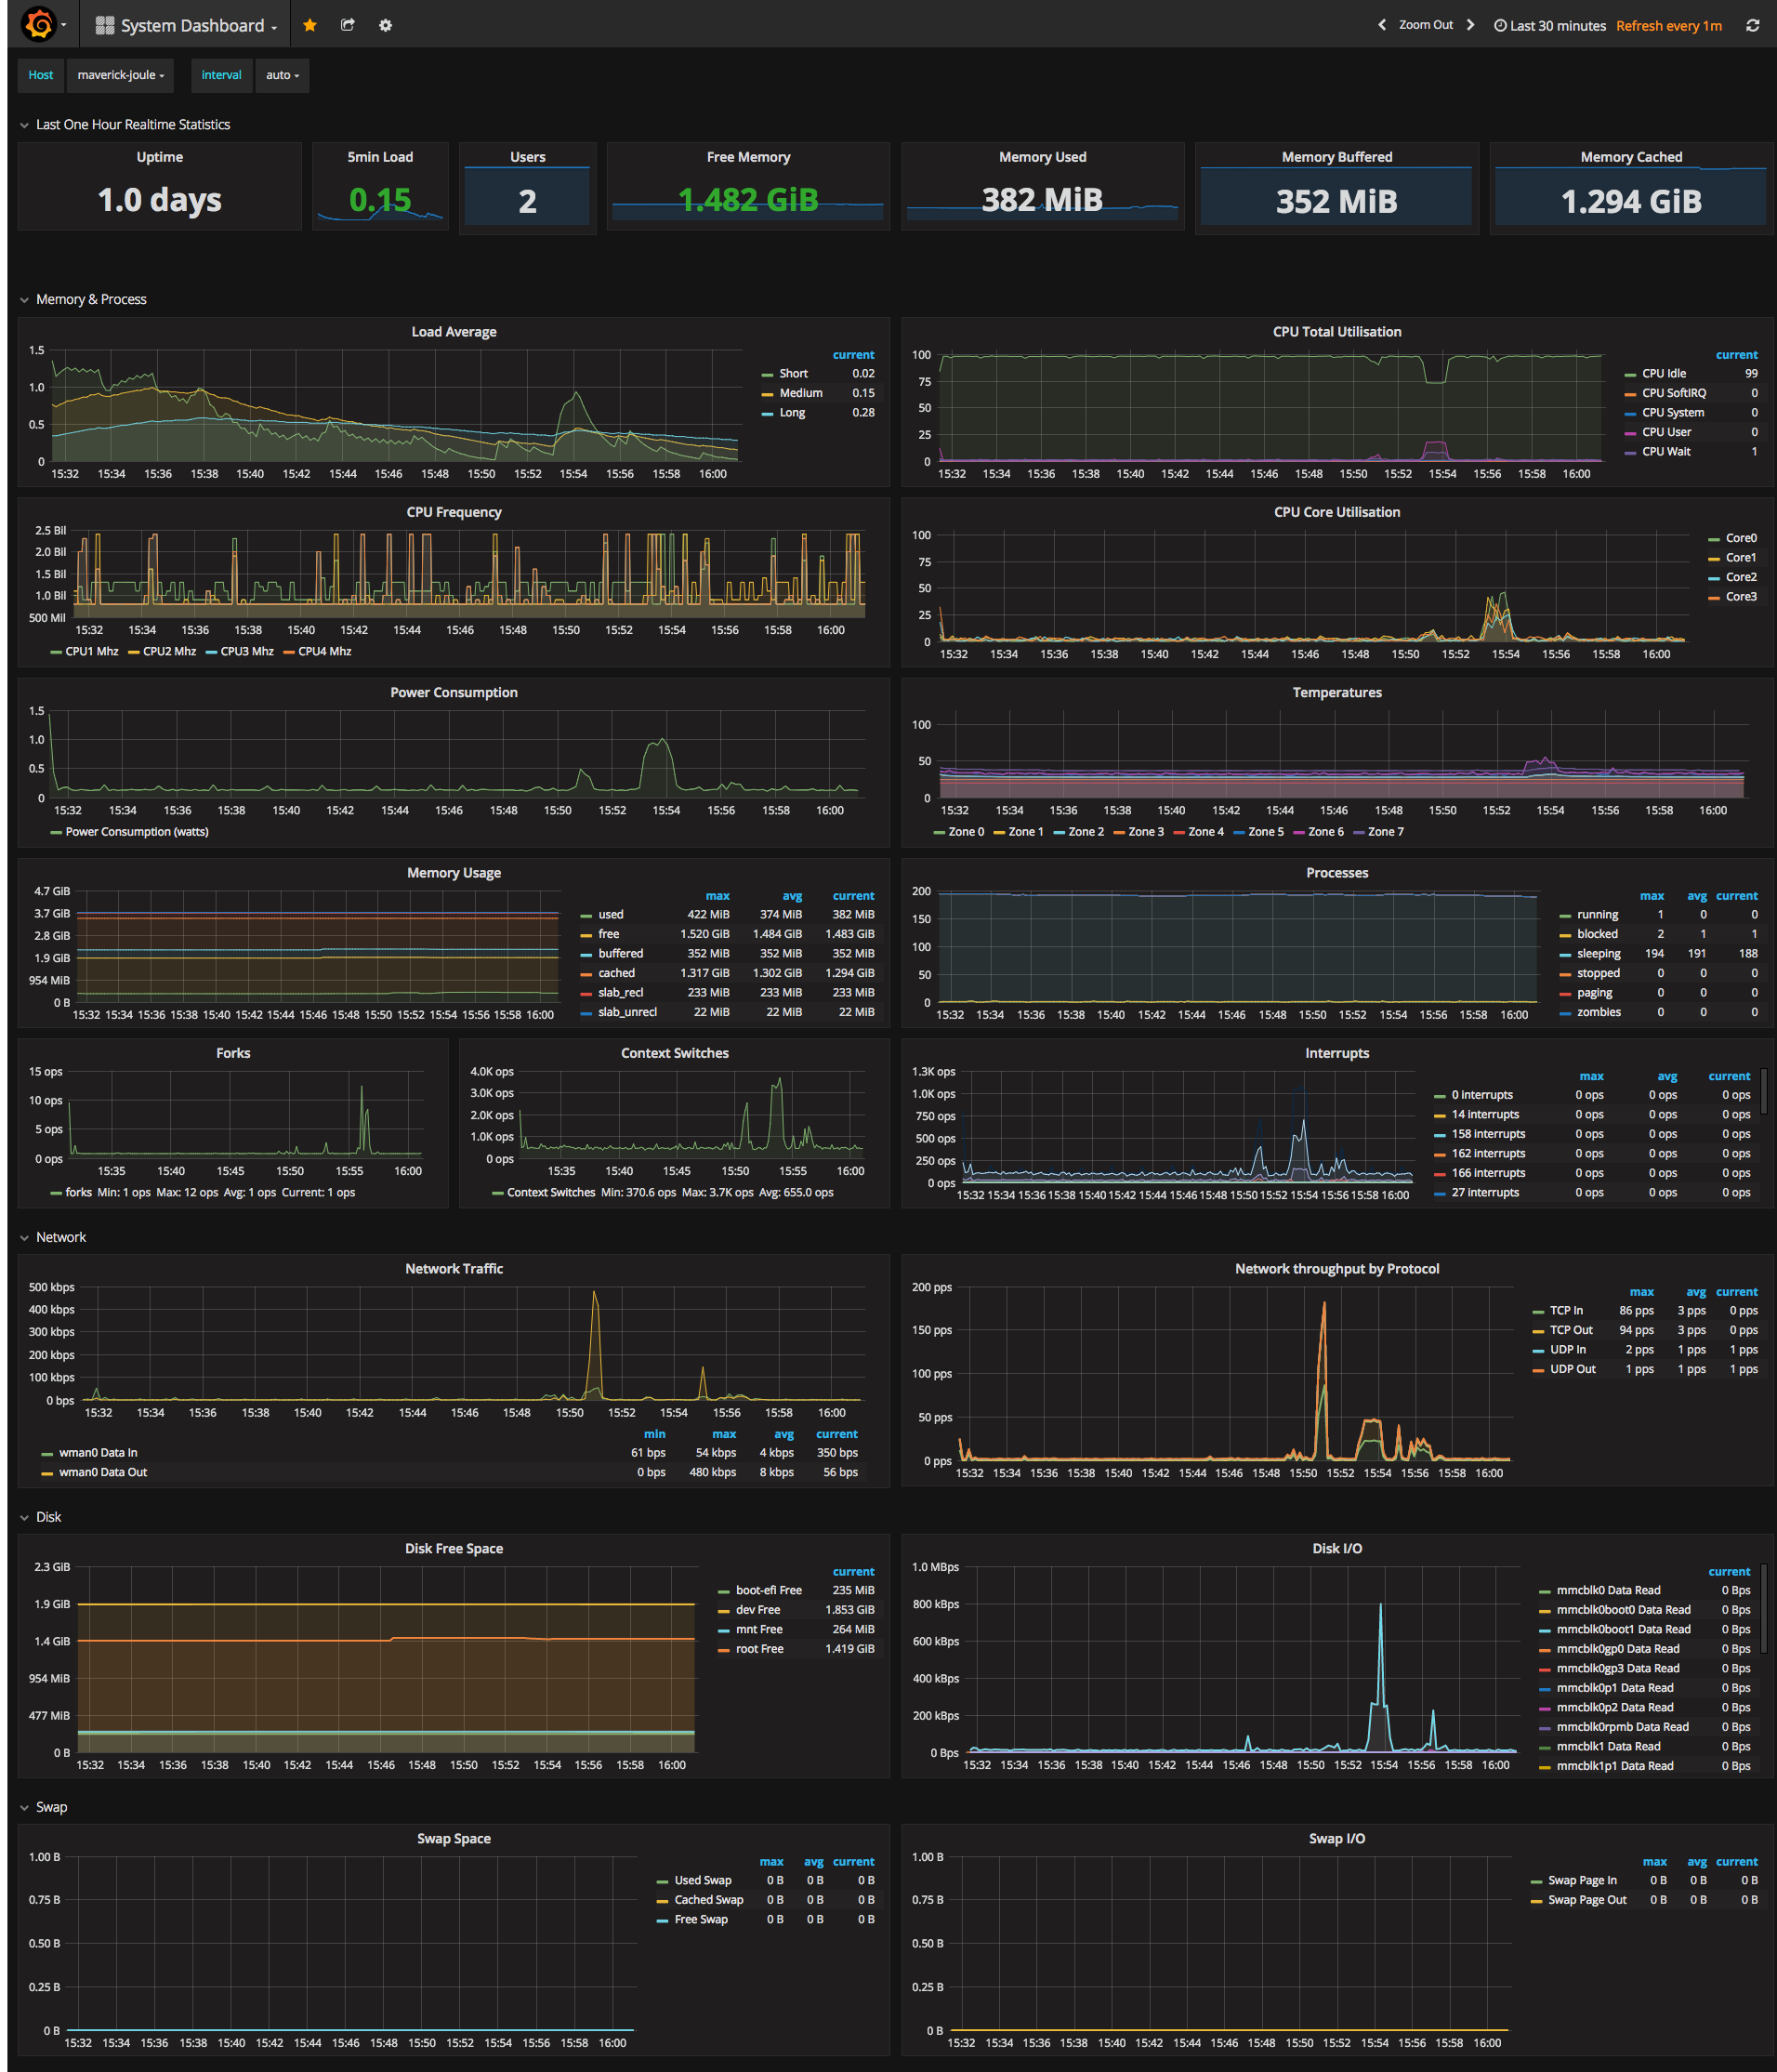
A wide variety of system metrics are automatically collected (using collectd) and imported into InfluxDB, and are available in realtime in the System Dashboard, including power consumption and thermal status for Joule modules
Best of breed opensource components - Collectd, InfluxDB, Grafana
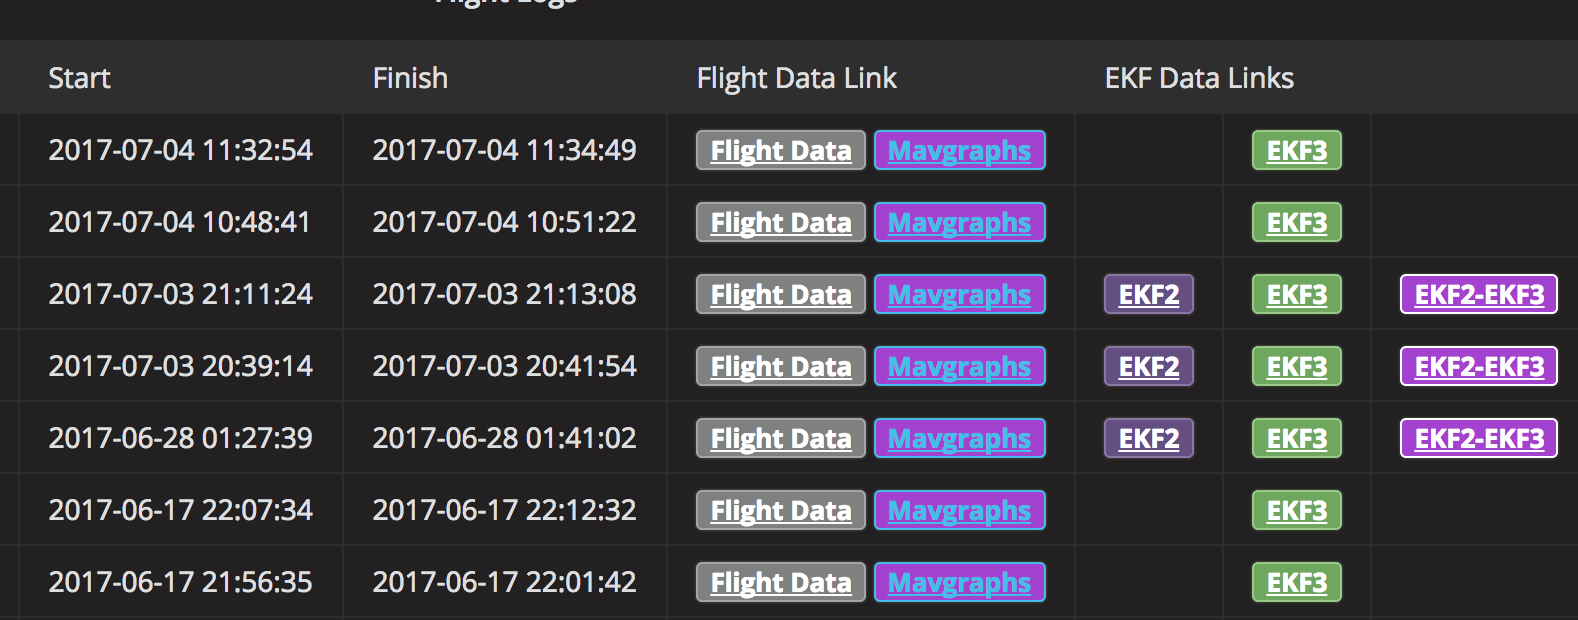
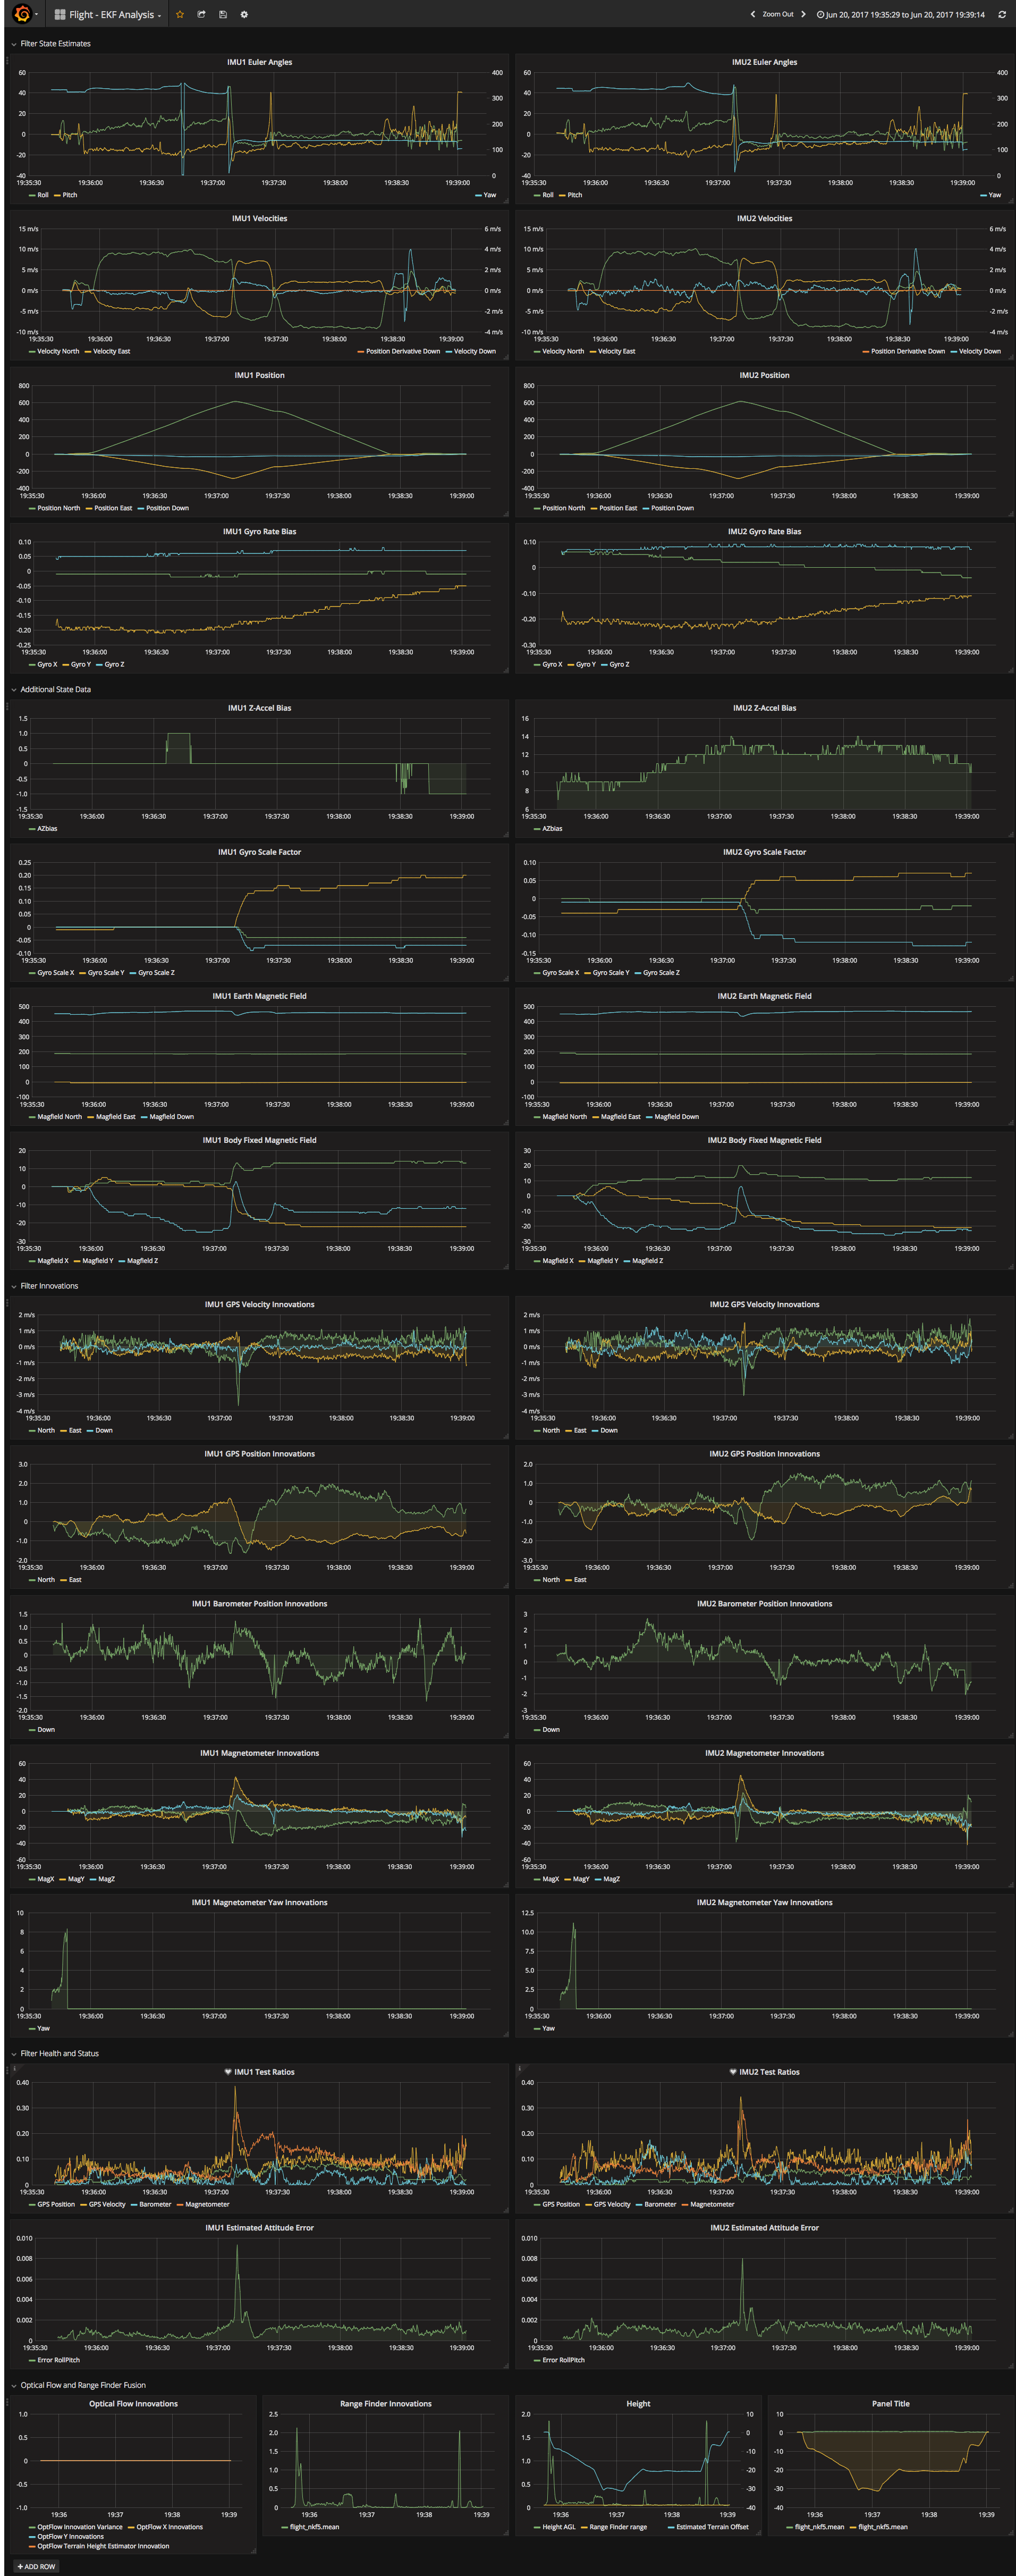
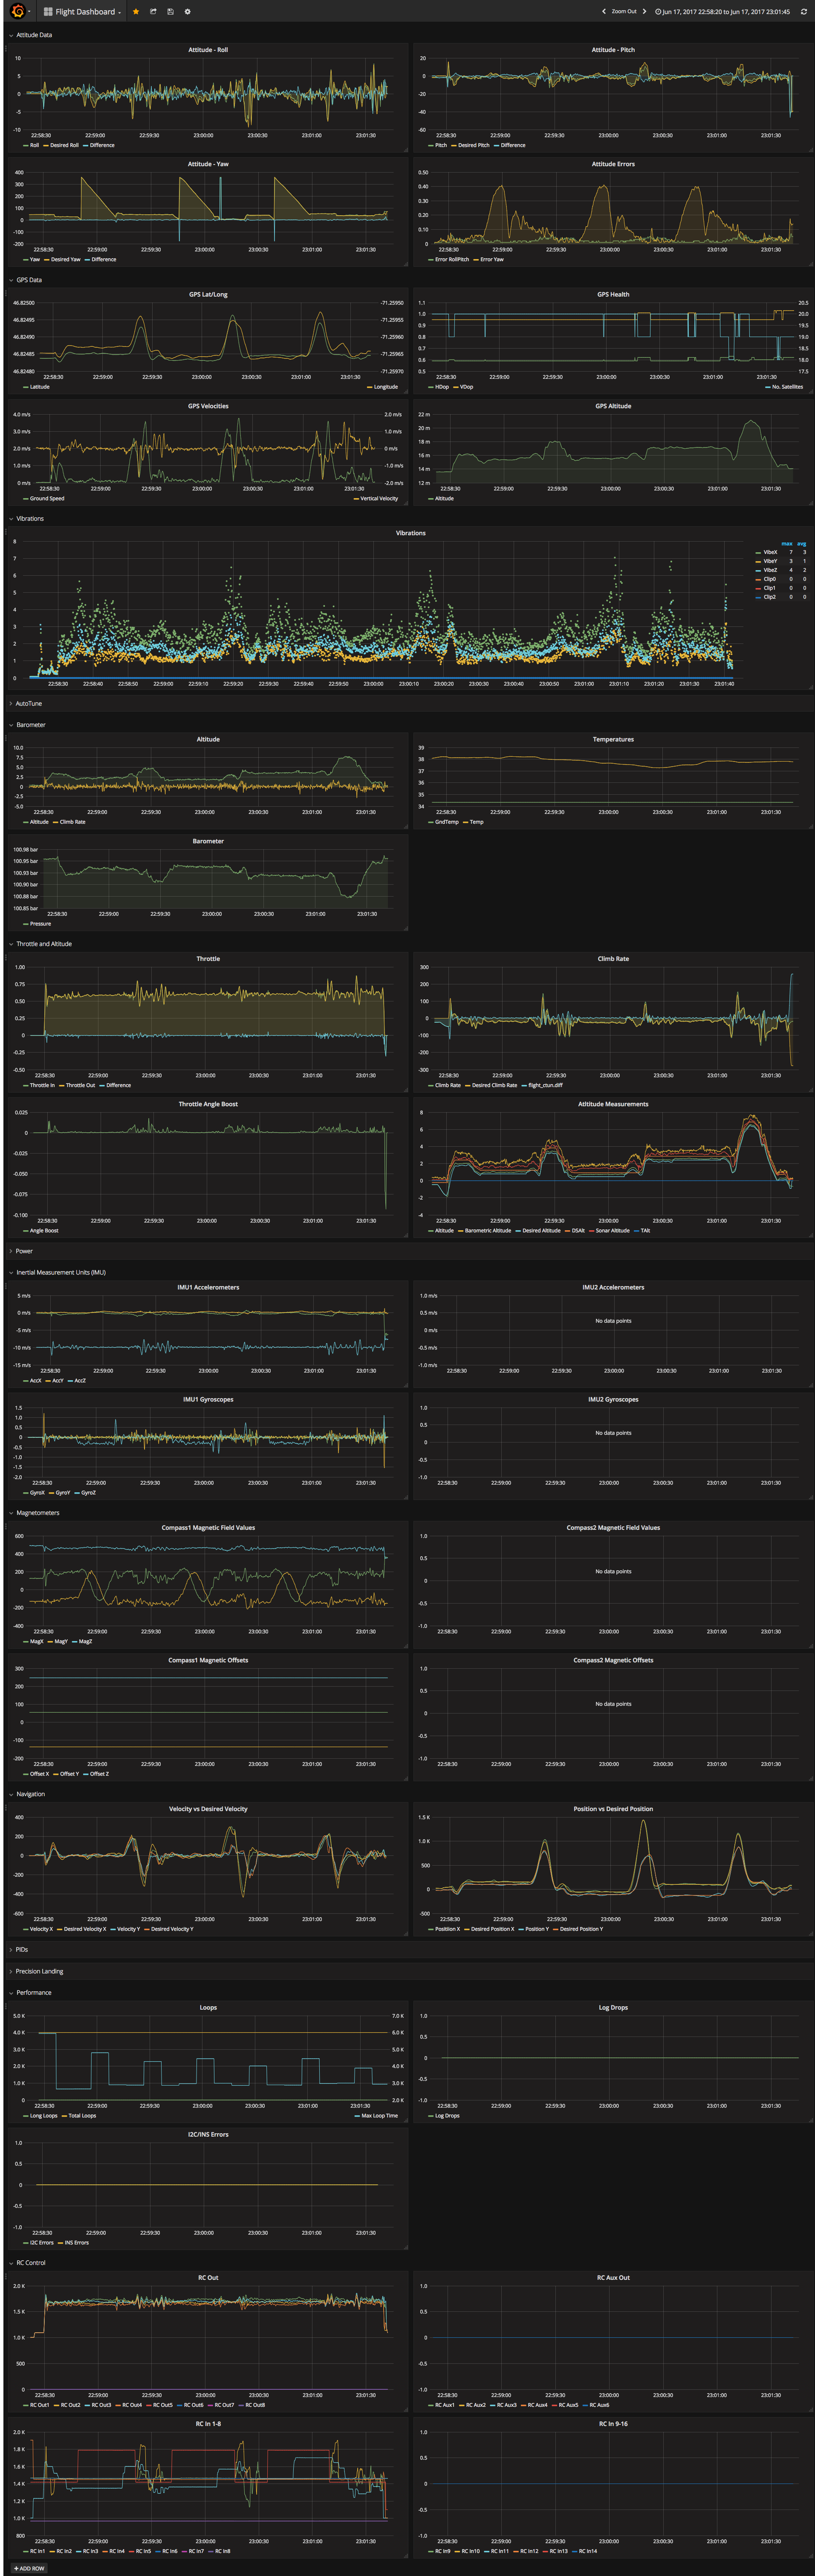
Preset dashboards for Flight Data, EKF2, EKF3, EKF2 vs EKF3, and MAVExplorer mavgraphs graph sets
Automatatically generated index dashboards for each flight and flight errors
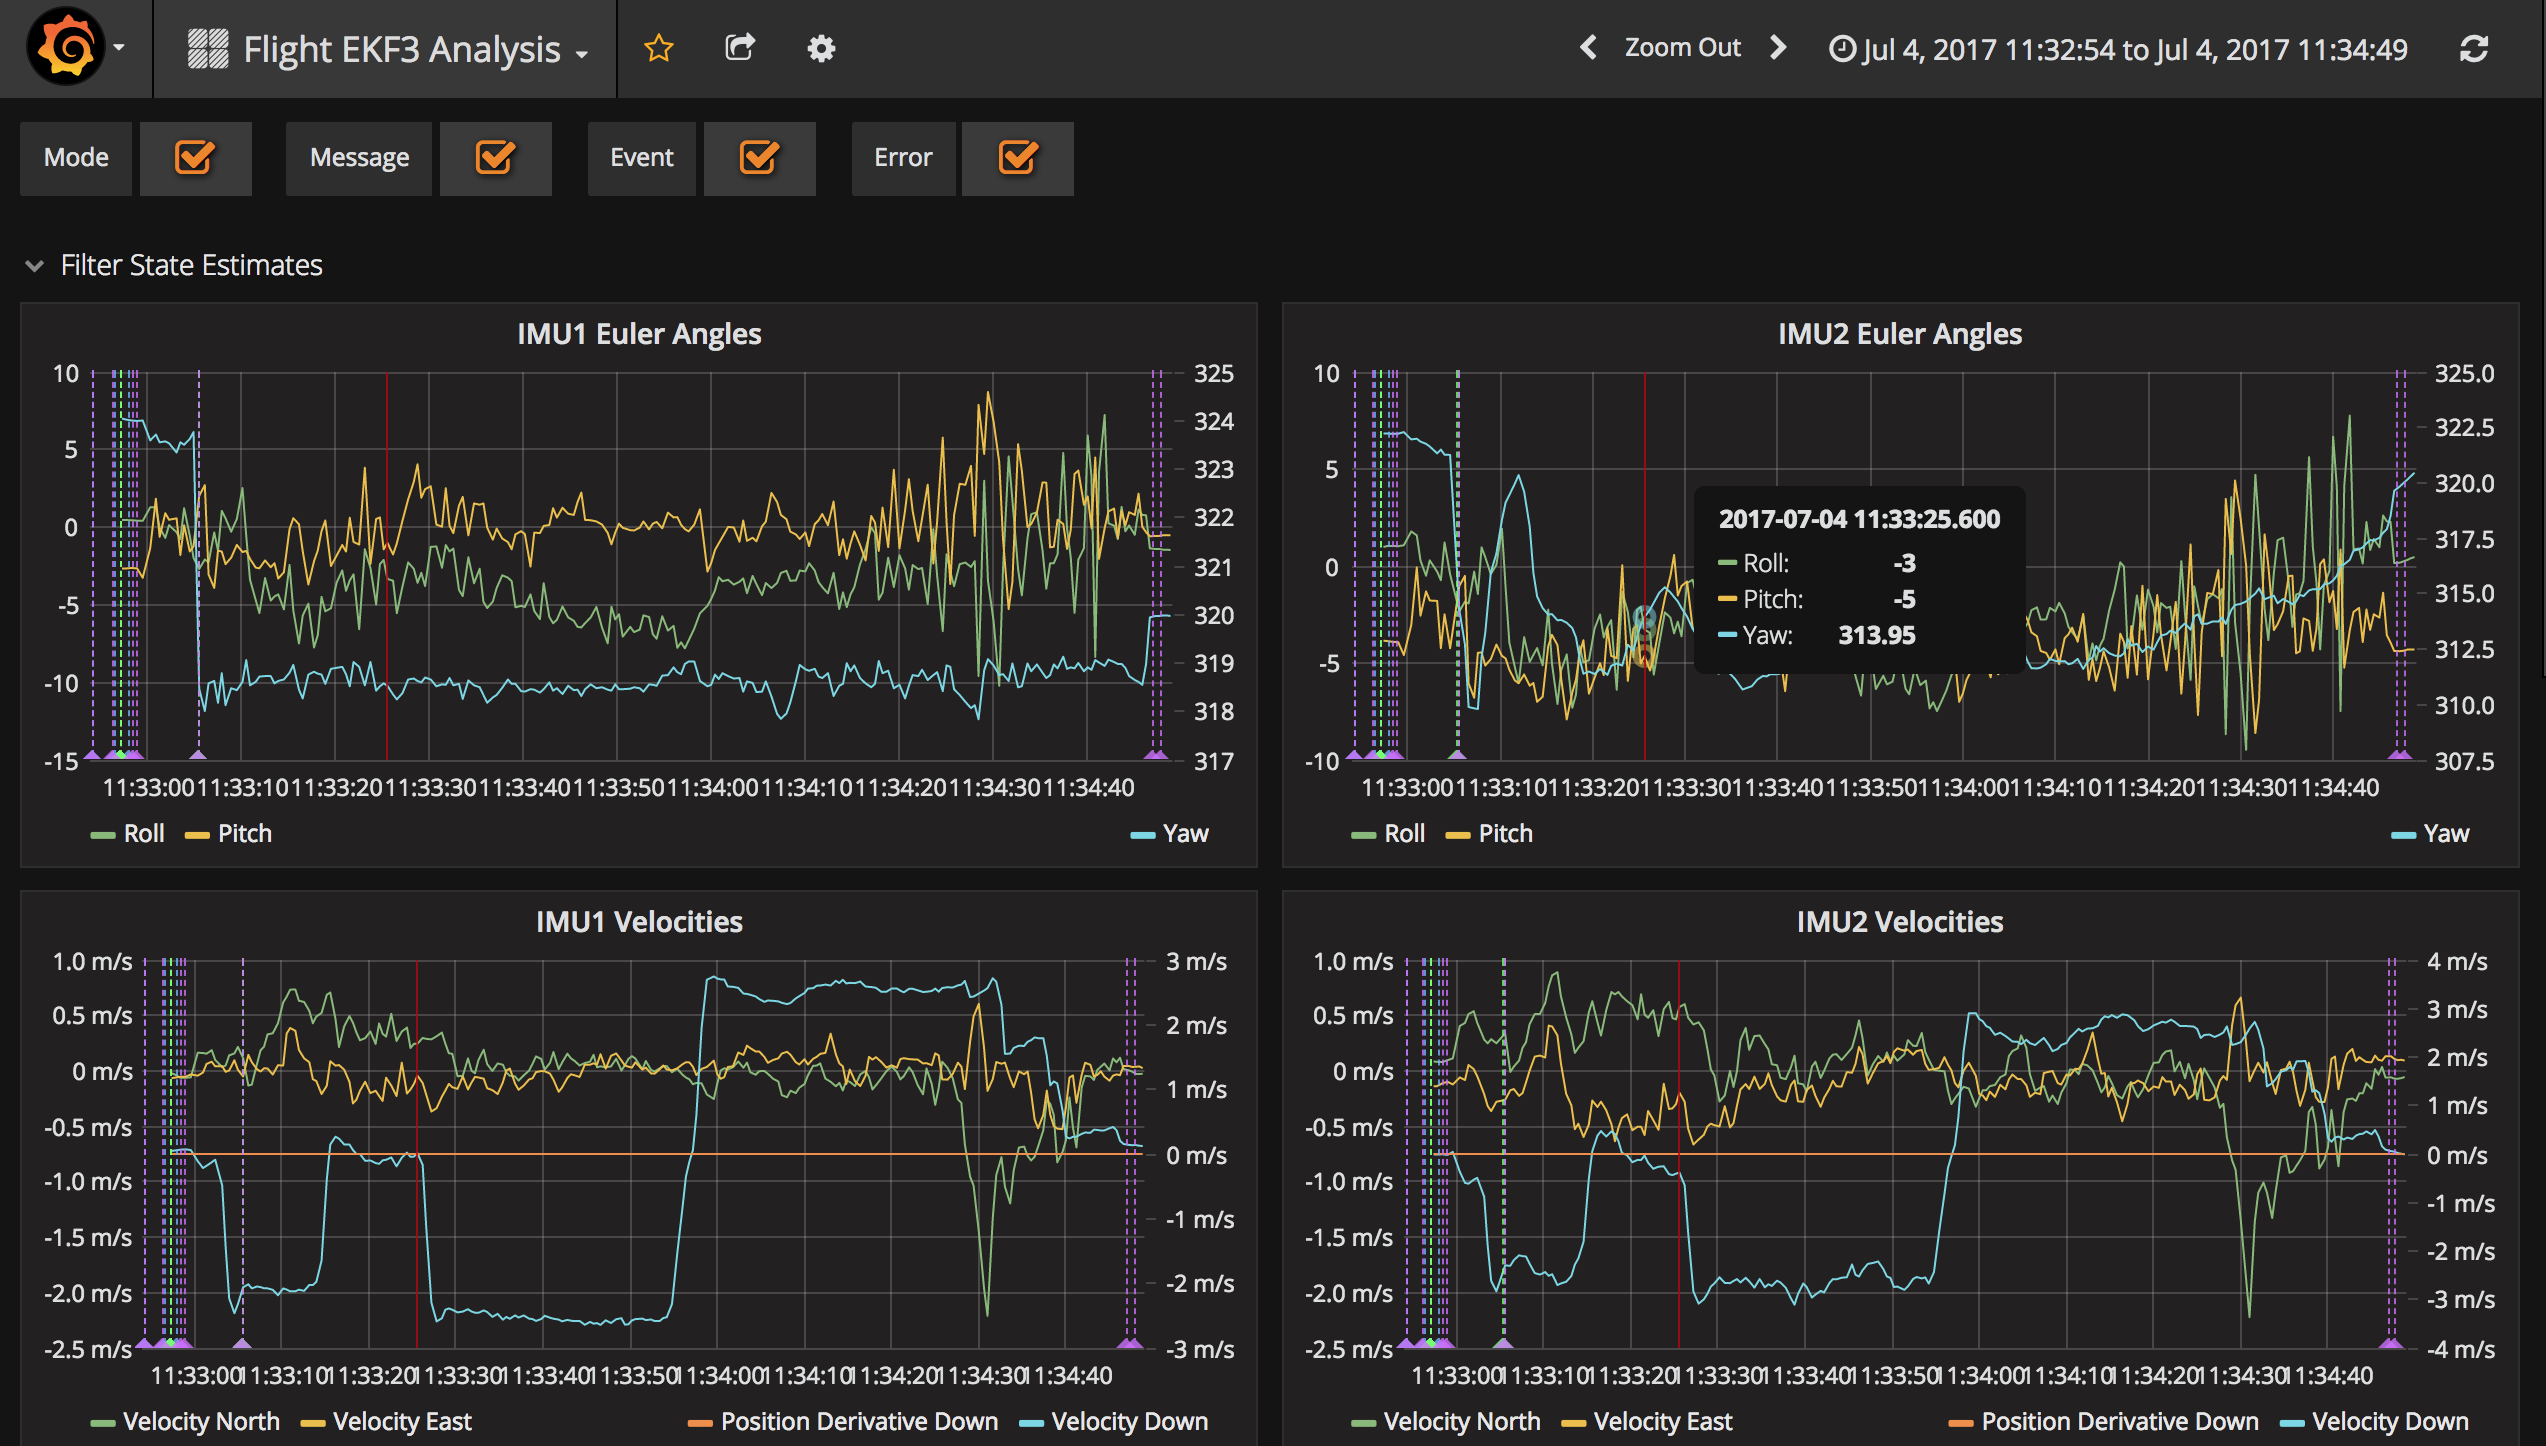
Interactive graphs, zoom in and out, select series, fullscreen graph, linked graphs, events, errors
In the future, rich custom analysis pages using statistical engines will be included
Realtime mavlink graphs will come soon to a browser near you
As always with Maverick, to update a previous installation just do:
Login - mav:wingman
Click on ‘Flight Logs Index’ to view the index of sample flight data.
Click on ‘Error Events Index’ to see all error events across all flights
Click on ‘System Dashboard’ to see sample system data (live data from the server)
This seems very promising! I couldn’t wait and decided to give it a try.
It seems that Raspberry Pi image is still on previous version (1.0.6). Using this image and running self-update and then configure, resulted in the following error:
Notice: /Stage[main]/Maverick_analysis::Grafana/Exec[grafana-maverickorg]/returns: Error: no such table: main.org
Error: ‘/bin/sleep 10; /usr/bin/sqlite3 /srv/maverick/data/analysis/grafana/grafana.db "insert into main.org values(10,0,‘Maverick’,’’,’’,’’,’’,’’,’’,’’,‘2017-06-20 11:02:55’,‘2017-06-20 11:15:51’)"’ returned 1 instead of one of [0]
Error: /Stage[main]/Maverick_analysis::Grafana/Exec[grafana-maverickorg]/returns: change from notrun to 0 failed: ‘/bin/sleep 10; /usr/bin/sqlite3 /srv/maverick/data/analysis/grafana/grafana.db "insert into main.org values(10,0,‘Maverick’,’’,’’,’’,’’,’’,’’,’’,‘2017-06-20 11:02:55’,‘2017-06-20 11:15:51’)"’ returned 1 instead of one of [0]
The following stages are skipped due to previous dependencies.
Thanks for the bug report That looks like possibly an ordering issue - it’s trying to setup the data before the database has been initialised. If try a configure again, does it work? (In general with maverick/puppet, if you get an error, try it again once or twice as it might fix itself, if it’s just an ordering issue. It’s really hard get all the ordering right in complex non-deterministic systems when you’re making a lot of changes!)
ps - I won’t always update the downloadable images for every release, as they take a while to create and upload. Normally, self-update/configure should be just fine. But while there’s still a lot of flux as I’m still adding major features/functionality, it will break once in a while. Sorry about that, I’ll fix them as quickly as I can when they get reported. You can raise an issue in the github as well if you want.
In the future, I’ll at least test a release from the currently posted images.
@FabricioSilva - Sorry for the delay, I’ve just done a 1.1.1 release with a whole bunch of bugfixes and updates. I’ve also tested it doing upgrades from previous releases and also uploaded new ready-to-go images.
For the 1.1.1 release:
Added and improved the indexes which jump straight to the timeranges and dashboards for every flight or error
Added ‘annotations’ - selectable groups of vertical lines on the graph that tell you about each event when you hover over the little bottom triangle
Added EKF3 dashboard for single or multiple IMUs, and an EKF2 vs EKF3 dashboard to compare EKF2 running on one IMU and EKF3 running on another IMU
Added a quick port of MAVExplorer ‘mavgraphs.xml’, available through the flight indexes ‘Mavgraphs’ links. Ports of other MAVExplorer graph sets can be done, but if there’s interest in this graphing system it’s probably better to spend efforts at overhauling the graph sets generally.
Great! I’ve been testing Maverick since then. It’s a very interesting idea. It has great potential.
In RPi 1 (model B), it is quite slow. “maverick configure” takes 11 minutes to run. I even had to replace mavproxy with cmavnode, due to high cpu usage, The switch was flawless: +1 for Maverick.
I experienced some limitations, but it might be because I’m used to configuring things by myself. I’ll let you know when I have a well formed opinion about your project.
I am trying to run Maverick on a Raspberry Pi 2. The image boots fine at first, maverick self-update works, but maverick configure gives different errors. I copied the output into a textfile:
Hi, that libjpeg package has caused some problems, it’s named different things on different platforms…
Could you please grab the log out of ~/var/log/maverick, and raise an issue on github?
thanks


 That looks like possibly an ordering issue - it’s trying to setup the data before the database has been initialised. If try a configure again, does it work? (In general with maverick/puppet, if you get an error, try it again once or twice as it might fix itself, if it’s just an ordering issue. It’s really hard get all the ordering right in complex non-deterministic systems when you’re making a lot of changes!)