
PETE!!! I just realized you’ve managed to get the VOLTAGE READINGS mapped out on Google Earth!!!
Your a GENIUS, a LEGEND!!!
1 Like
Yeah, it should be fairly straight forward to pick any varable from the logs. We should be able to get it to do some much more complex plots, depends on the sort of data you want to display I guess. I think it should be fine as it is for a proof of concept until you get some data from the actual sensor
Glad I could help, discovering the matlab google earth tool box has opened up very useful ways of displaying data I think.
1 Like
Octave is basically free matlab, maybe there is a equivalent google earth toolbox tool box. I think if your learning a new language from scratch you might as well learn something free. i only use matlab because its what I know. For me this project would have taken much longer in another language. The toolbox does make it very easy.
hum, not sure, see if you can find a example of something similar in goodle earth. ie google earth must support it for us to be able to add it to the KLM.
We can do pins and labels and things, maybe this would go some way towards it.
Really i think this line altitude method is not a good way of displaying the data. If you mapped a area for example a contour plot or heat map overlayed on google earth would be a much better solution. As i say once you have collected some proper data from your sensor we can try out a bunch of different plot types and see what works best.
% scale for a better output to google earth
% offset so minimum value is zero and range given
% as this is ploted as altitude in earth must be a sensible range
varable_scaled_range = 100; % m
varable = varable - min(varable);
varable = (varable / max(varable)) * varable_scaled_range;
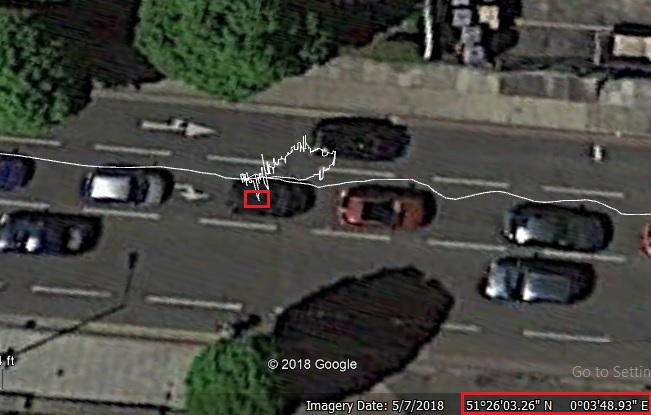
If you look in this section I have reduced the varable_scaled_range From = 250; % m to 100; % m
it has shrunk the lines down allot and has made the spikes in voltage appear more clearly and much closer to ground level. This way I can pinpoint the coordinates much more easily as
Ideally it would be nice to have the data viewed whilst scrolling up and down the line giving a much more accurate reading but im not sure what needs to be added to the coding in order to transfer the data from Matlab into the KML file
not really, we need data for a area rather than along a line. I guess you would want to be mapping a area rather than just a single path? Also battery voltage and current are bad things to plot over a area as they are not dependent on location.
For sensing the leds you probably done need a external sensor, you should just be able to hook up to the leds directly to the APM. Very hard to say for sure without having a close look at the device. maybe you could try and get some high resolution images square on from the top and bottom. And see if you can read the number of the black rectangular chip between the 3rd and 4th one.
It can, but voltage of the battery varys with time not location. ie you can be in the same place and get to completely different battery voltage readings, so the plot would just look a mess. Voltage from a sensor would be fine as the voltage is dependent on the location. so you would get the same reading if you came back to the same spot.
this would be very useful.
The thing is when the device hasn’t detected anything none of the led’s are lit up, it’s always off until it’s triggered. I’m no electrical tech person but I assume that if the led isn’t lit at all there would be zero current or voltage & only when the first led is lit up that would trigger a reading. With the APM battery it’s constantly on and fluctuating but it’s never off completely or idle whilst running. With this device that I want to get the readings from, if the led isn’t lit up it should read zero current or maybe something very low until it’s lit. What do you think?
I will also open the device this evening once I’m home from work and get some pics sent over to you.
Also Pete I know you said you didn’t want any money for your help but please accept something for my gratitude and appreciation for all your efforts. Wether this all works out or not you’ve earned some reward for helping me out. When your ready send me a private message with your account details or PayPal, whichever you prefer & I can send you over some money. Many thanks
I think i would read the voltage of each led, then we can do a threshold in matlab to tell if its on or off. Then you will get a 1 to 5 number to plot. Or do they come on gradually? this could be more tricky.
I haven’t done much, just a few lines of code, if it has helped please make a small donation to Ardupilot.
1 Like
I found this example which is a tool that follows the path line really well. I’m not sure if its compatible with google earth tho. right now it seems to be coded to show the the following data when the mouse cursor is dragged across the path line - Clement Latour (Tue, 19 Apr 2011 12:05:18 GMT)
Maybe this tool can be coded to show the coordinates? Not sure if it can be done but its the closest tool I have found which kind of does what I’m looking for
hum, I think its certainly possible to wire up to the leds, but I’m not sure i’d like to advise how without having a closer look and probing it all out. If there is anything wrong with the circuit you could easily fry the flight controller and the device. Not to mention the super fiddly soldering job.
I guess it doesn’t have a serial port or an other method to connect to it directly?

maybe the headphone output is the way to go, might be able to charge up a capacitor to make a analogue voltage not sure, would have to do some research.
not sure about in google earth, could do it within matlab
This is defiantly a step in the right direction, I think in this case the reading will be proportional to volume of the beep. Is this the case with your metal detector, or do the beeps get more frequent?
A capacitor would smooth out the voltage such that the more frequent beeps build up the voltage and less frequent beeps allow it to drop off. Would need some care to select a suitable capacitor value tho.
Hey Pete,
I think the capacitor is a good idea if it smooths out the signals and makes for better data analysis.
Just wanted to say thank you for all your advice & help. I wish you a Happy New Year to you and your family and hope 2019 brings you all the very best.
I’m going to give you a break for the time being and when you have time to contact me in the new year just drop me a message and we can continue on the progress. Thanks again & I will definitely make a donation to Ardupilot. Cheers mate
Hello Pete. Just wanted to ask if your available to chat briefly about a rover basic setup. There’s a couple of questions I want to ask so please message me back when you have time. Many thanks
Hi Mus,
I see you have been looking into rovers, I would certainly second the recommendation for AION Robotics,
With the cube fitted it comes to about £1000, depending on the exchange rate, and you might get stung for tax ontop when you import it. This would certainty be a very capable rover, and would be ready to go out of the box (would still need a bit of work to fit your sensor).
I have recently started a small business working on unmanned vehicles, we could certainly fit your sensor (and a autopilot if necessary) to this or another rover platform to provide a fully working system with tech support and/or provide some training on the hardware and how to operate Ardupilot (we are based in South Wales but could travel).
I will of course do my best to answer any questions you have about rover set up here on the forum in my spare time so fire away.
1 Like
Hey Pete. Hope your keeping well mate. Thank you for the info & yes maybe the right choice for me would be to go for something that’s already built and ready to rock and roll.
I have seen this webiste before & they have amazing rover builds. Regarding your new business, congratulations and do you think we could arrange to build something similar to the Aion robotics rover you’ve showed me in the link? If it’s possible for you to build me something similar for a similar budget I’d much rather the money goes into your pocket & that way I can avoid a hefty import tax bill. If you have the time to build me something like this it’d be great.
Let me know if you can and we get the ball rolling.
I live in London & I would also be happy to travel & meet you halfway or we can talk over the phone, Skype etc to finalise everything before beginning the project if you choose to take it on. Thank you Pete
Regarding this rover. The size is really small. I mean it’s 18 inches in length when a 1:10 scale rover is 23 to 24 inches. And I was thinking that 24 inches is pretty small never mind 18 inches. I don’t think the size is suitable. If only the size was bigger.
It would cost me pretty much the same £ to buy this custom build and ready to run rover which would save me allot of headache. Just the size is a concern