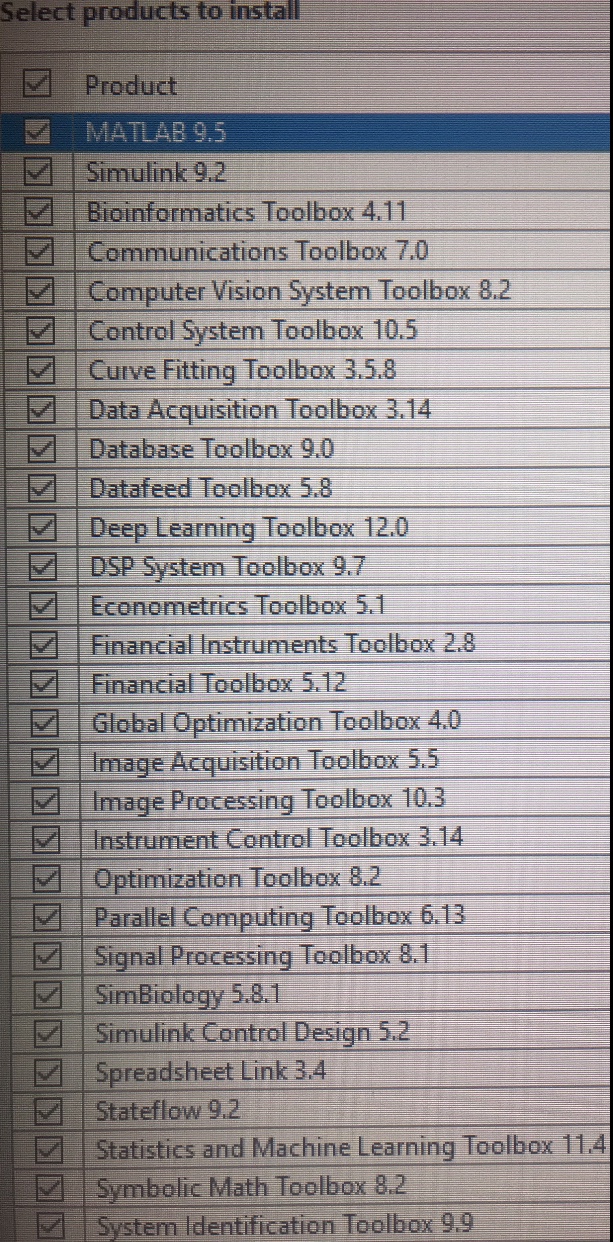
Also Matlab is over £100 to purchase. Would I need to buy this in order to make this happen or do you own this software to create the code? I’ve downloaded the trial version if that’s any help?
I have download it already and to be honest I’m way over my head with all this. I will leave it to you Pete. Is the new year the earliest you can create this coding for me to try? Whatever time your able to do it please accept a donation from me for all your help. I insist. Once we are all done we can discuss privately a way for me to send you some money for your efforts.
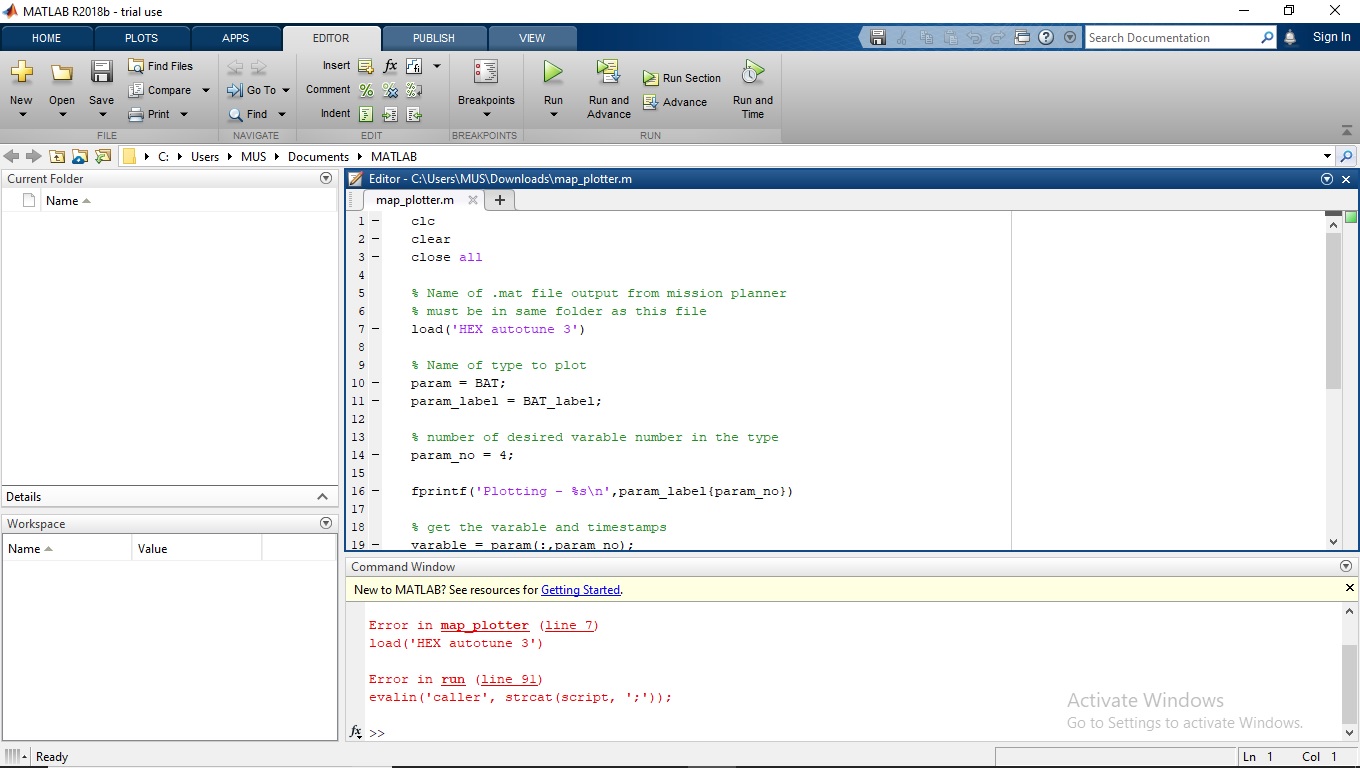
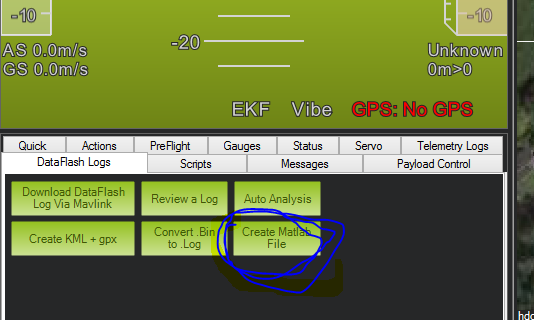
Should be straight forward, you can convert to a matlab type file using a button in the datflash log screen in mission planner, just put the name of the file into the code on line 7.
The variable to plot is then entered on line 10 and 11. This is from the varable types such as these. I have set it up to plot battery voltage as it is. This just plots the data within matlab. Will be some more work to export it again to use in google earth.
To do contor plots you need a surface fitting toolbox that I don’t have on my laptop. Also there is a mapping toolbox that may do what you want without having to use google earth.
Thank you for that Pete,
Could you please be so kind and make this into a simple “for dummies” format for me. For Example:
Step 1: open mission planner
Step 2: convert log file to Matlab type file
Step 3: open Matlab
This way I will understand. Maybe you have really watered down the steps to make a noob like me get it, but honestly it’s still hard for me to digest which is why I ask for a step 1 step 2 scenario. I’m sorry to push your patience. Once I go through the steps I can message you and let you know if everything works or if there’s any errors. And again I’d like to say that I’m paying for your assistance. Once this is sorted I can message you directly for payment details. Can’t thank you enough mate you’ve really helped me out
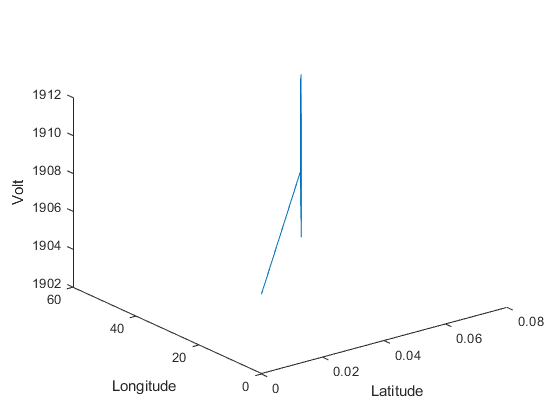
This is from your log, its not that impressive, the data seems to be logged at some scale factor on the old firmware running on your APM, would be easy enough to find the scale factors to fix, just not much point.
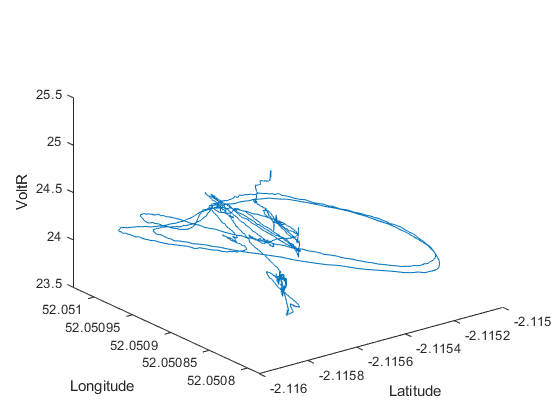
As a better example this is a log from my hexcopter
my data made me laugh. your right there is hardly anything on there. i know its late but i am going to get in my car with the apm hooked up to the lipo and take a drive around the block. hopefully will have something more in depth to send you in 10 minutes
no gps data in the latest log, not sure why, will have a proper look tommorow. Now you have the file open in matlab its quite striaght forward to run.
To make matlab files click this button in mission planner
Just open a .bin such as the ones you have uploaded. Then put the new .mat file in the same folder as the matlab file (look like your downloads folder). You will then have to enter the name of the file into the matlab code on line 7. ie if you rename the .mat you exported to test.mat the line would be load(‘test’)
Then because of changes to the data flash structure you will have to change the param and pram label to be
param = CURR;
param_label = CURR_label;
you should then be able to reproduce the plot i made from your first log (click the green play button ) If you want to plot other stuff you can change the param and param_label to be other things. The stuff you have to pick from will appear in the workspace (lower left box) once you have run it once. The param number defines the column to plot in the param this is given by the params label variable. ie in CURR 1 = line number, 2= time, 3 = voltagge, 4 = current …ect
Unfortunately these values are all scaled so there not real word values, this was changed in the code at some point after APM support was dropped, so on my logs from the latest release I get sensible values.
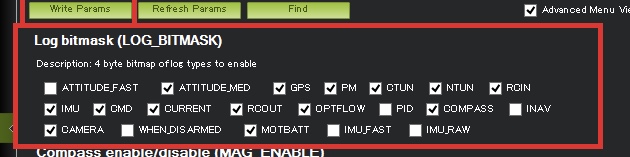
Potential problem for lack of data could be the result of my unticking many boxes in the BITMASK section to save on the internal memory of the apm.
Please let me know which boxes are essential to be ticked, I will do this in the morning before I leave for work, I will take my apm to work and log the journey & do another log on my return home. Then I can send you the .Bin files and we can see if there’s any additional data which will improve results. Then I will work on your instructions in changing the coding and if you have time you can give me a hand. I’m off to bed now. Thank you ever so much Pete & I look forward to speaking again tomorrow evening. Take care
The picture I provided is an example from google images. My one probably only has “Current” selected. Should I tick anymore if I only have one ticked? Let me know and I will give it another shot tomorrow. I’m determined to get this working
Managed to get the current and voltage data from your coding. even the apm board current readings are available which is cool. now all that’s left is to figure out how to view this in google earth.
I have found this excellent matlab google earth toolbox. Just download and extract it, then add the toolbox to Matlab using the addpath command, for me it was addpath(‘C:\Users\Peter\Documents\MATLAB\googleearth’)
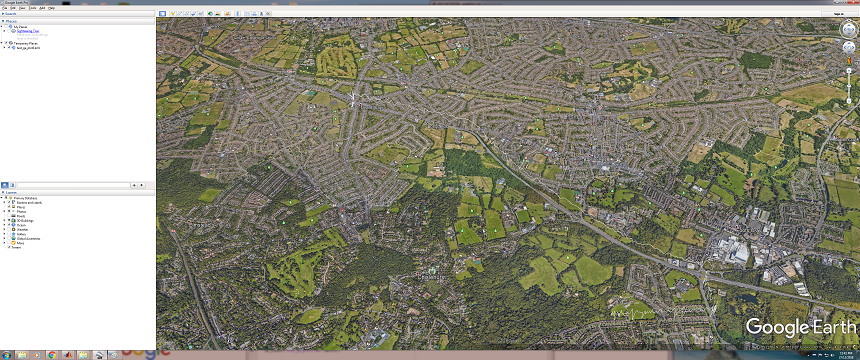
Then you can plot direct to kml files. This is the voltage as altitude.
Looks like there is loads you can do with this toolbox, things like surface plots, contor plots and heat maps should be fairly straight forward. We can change the line colors and thicknesses, export loads of plots into a single kml ect. I have only had a short time to play this evening but we should be able to work out more complex stuff.
For this example I have offset the data to be plotted in the z axis(the altitude) such that the minimum value is zero and the maximum is 250 meters. Other wise the change in the value is hard to see.
I have uploaded the two kml files, the .mat file from your log and the updated matlab code here.
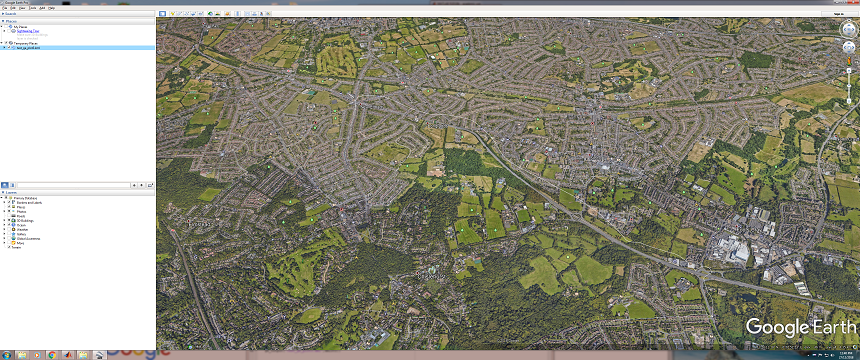
Hey hope your keeping well Pete. Just checked out what you created for google earth speed analysis!!..its very accurate as the speed drops significantly right before the speed camera so the data is 100% accurate. amazing mate this has made my day.
I’m having some trouble getting the google earth app to run in Matlab. Ive installed it correctly but its not showing up in the apps tab or the plots tab. Not sure what I’m doing wrong. If you could let me know that’d be great. Thank you so much for your work with this its looking impressive.