I agree with @Andre-K that the APM2.x flight controller should really be replaced with a more capable modern board like one of these. I can’t really provide any support for the old APM boards.
At the risk of being a bit pedantic but just to clarify terminology:
Mike your advice is definitely making me understand. I’ve looked at the parameter list and it’s HUGE! how can I go about making the onboard logger just save the snail trail of where it’s been alongside the voltage/current readings?
Please bare in mind I’ve just got the APM yesterday and I’m literally bamboozled with how I’m meant to set this all up. I really need some help to get this working and I’m willing to pay anyone who can help me via PayPal. If your someone who can offer me this service let’s get started & I can send you the funds any time your happy to start:+1:
Thank you for your reply Randy. I know you said that the version I have is not supported but if you could make an exception I would be happy to pay you via PayPal to sort this all out for me. I’ve watched your YouTube videos & I know your more than capable of getting this up and running for me. If you’d be happy to make an exception and perhaps we have a Skype call and a walkthrough of what I want we can come to an arrangement & I can send you the funds for your help. Many thanks
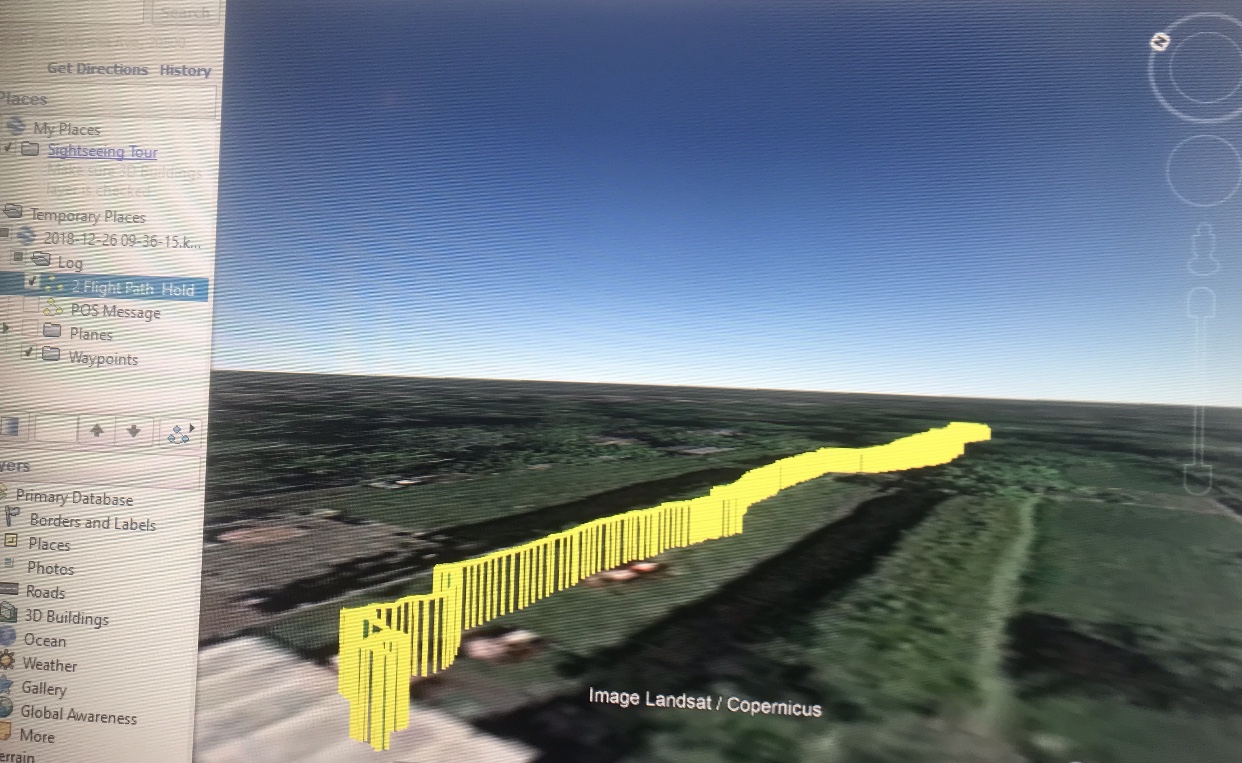
Mike I have just successfully recorded me walking down my garden with the APM 2.8. Once in Google Earth the KMZ file opened & I can view the Flight Path. Just wondering now how to access the voltage readings from my walk and view them in the same way.
Under Config/Tuning Tab - Advanced Parameters - (LOG_BITMASK) I have selected, GPS, CURRENT, COMPASS, STEERING.
The rest are not ticked.
Not sure what to do next. Damn this is harder than I was expecting :[
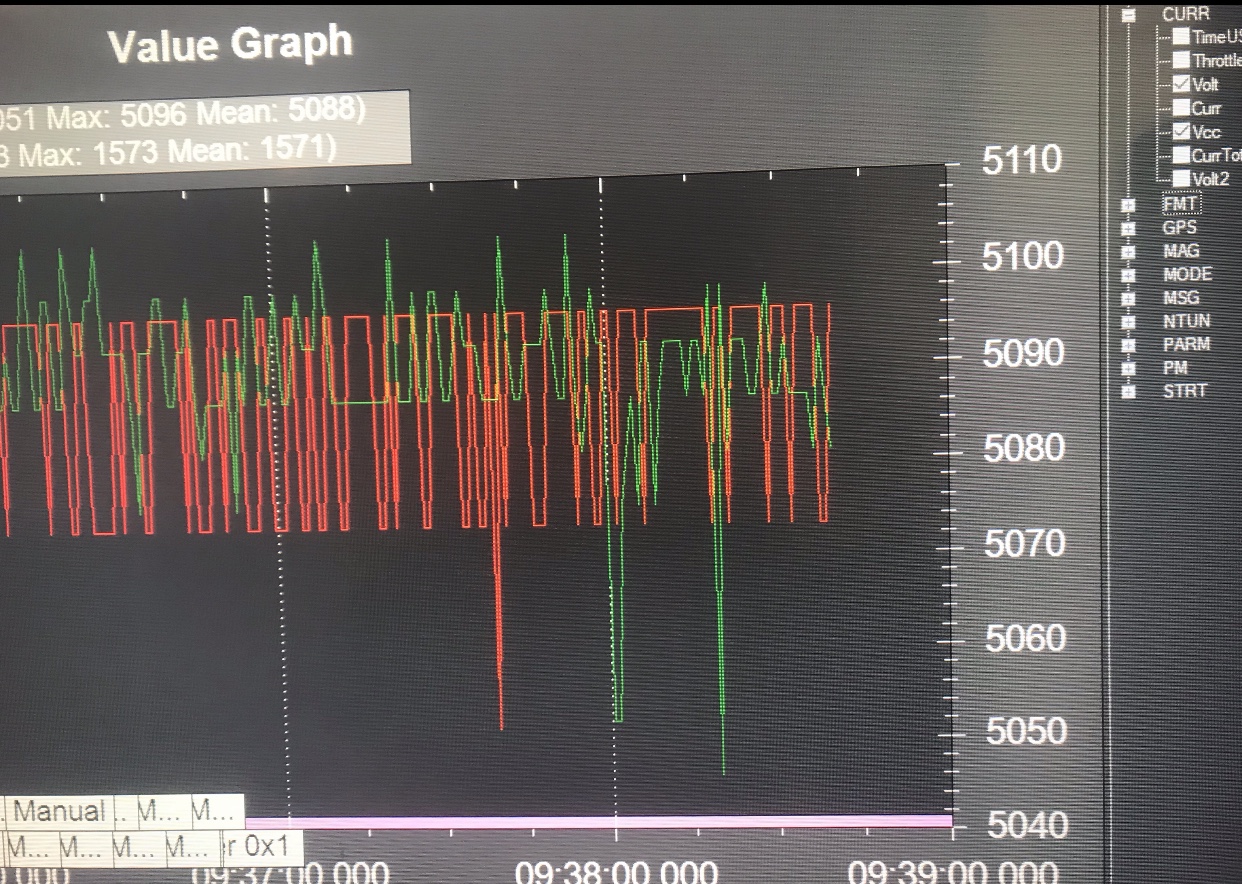
I’ve also managed to locate the Voltage & Current Readings from the flight data which was saved on the APM 2.8 and then viewed in Mission Planner. Now I need to figure out how to view this data in google earth the same way I viewed the flight path KMZ file. Please excuse my noob explanations as I’ve only had this for 1 day and ZERO previous experience. Many thanks to all of you who have taken time out to answer my questions and for your patience
I don’t know of any free software to do it directly. A short script in Matlab, octave, python, procesing or an other language. You could make such a plot the re import the image in to google earth. I think you would have to manually scale it and line it up however.
You are doing great. So you have downloaded the data from the “flight” and then used the tools in Mission Planner to plot the Voltage & Current readings over the length of the flight. But to synchronize those readings to the KMZ you will have to write a program to read the data downloaded yourself, rather than use the provided tools in Mission Planner. You will need to parse the data for the voltage & current readings and extract the data along with the timestamp of the time of the reading, then compare that to the KMZ data and associate and sync those timestamps with your voltage and current readings. Takes a little programming.
You could also do it by hand “I think” by playing back the telemetry data in mission planner and stopping the play back and note the voltage and current readings on your graph above at intervals during the flight. It depends on how precise and how often you need to do this. Mission Planner, under the HUD with the log save tabs, can load a telemetry log and play it back. You can see on the map the path and I assume the time. But I don’t remember exactly and I don’t have a windows machine with me at the moment.
Unfortunately I don’t have the time. But at the rate you are picking up Ardupilot you are not going to have any trouble. There are a lot of parameters but you don’t need to learn them all at once. Just the ones you need at the moment.
The telemetry logs record every aspect of the communications between the ground station and the aircraft, or in this case groundcraft during a flight. Where it is, how fast it is travelling at etc. Playing back the telemetry logs, saved automatically on your computer, recreates the flight on the map display in Mission Planner. That with it’s timescale should allow you to pause the playback and note where the rover is on it’s path and then check the dataflash log for the current and voltage measurements at that moment. It would not be good enough technique for a engineering analysis but if you just want to get an idea how the voltage and current changes during flight this might do the job.
In basic terms all I want is to view additional data via google earth using the .KMZ file. The only data that I can see is the flight path.
I’ve ticked current in the BITMASK options and once the .KMZ file is created via the data logs it still only shows a flight path.
Need to know the exact steps to getting this data added within the .KMZ file to then be viewed via google earth.
Right now this seems impossible
Just looked the the Pix4D webiste. How would I go about getting this data on there? Also if what I’m after requires
Custom coding are you able to do this & if so what would your fee’s be for your services? Thank you for replying
Just downloaded Pix4D and it’s used more for adding loads of images to then create a 3D environment with some added features like thermal imaging etc. I don’t think this is what is required for what I’m after. Still a cool bit of software if people are taking loads of pictures via a drone and adding them into Pix4D Mapper
I have never used Pix4d myself, they must have a some tech support or something.
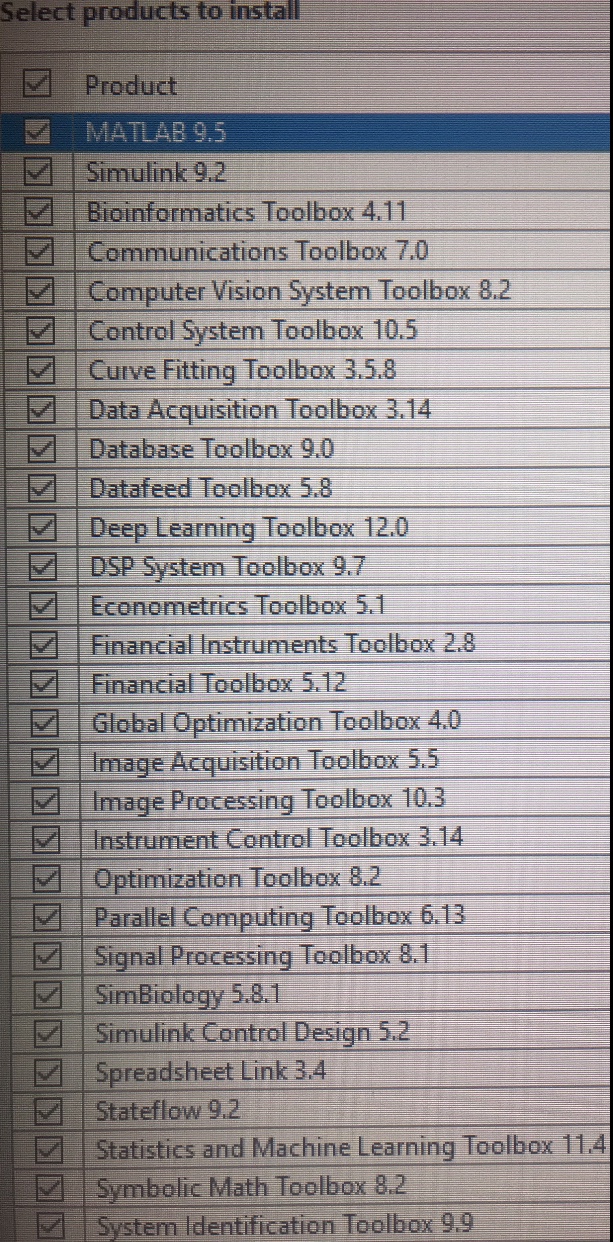
If you have assess to Matlab I could make a quick code for you to try out for nothing, I know matlab and mission planner already exports logs to a matlab format so it shouldn’t take long, would have to be in the new year tho.
I think it wouldn’t be too tricky to convert this code into octave, its basically free matlab.
That sounds great Pete, thank you very much. I don’t know what Matlab is. Please give me the details of what I need to do on my end and we can sort it out. I’m happy to send you some money even tho you said you’d be happy to do it for free. Can you do it now or do I need to wait for new year? Now if possible
Also Matlab is over £100 to purchase. Would I need to buy this in order to make this happen or do you own this software to create the code? I’ve downloaded the trial version if that’s any help?
I have download it already and to be honest I’m way over my head with all this. I will leave it to you Pete. Is the new year the earliest you can create this coding for me to try? Whatever time your able to do it please accept a donation from me for all your help. I insist. Once we are all done we can discuss privately a way for me to send you some money for your efforts.
Should be straight forward, you can convert to a matlab type file using a button in the datflash log screen in mission planner, just put the name of the file into the code on line 7.
The variable to plot is then entered on line 10 and 11. This is from the varable types such as these. I have set it up to plot battery voltage as it is. This just plots the data within matlab. Will be some more work to export it again to use in google earth.
To do contor plots you need a surface fitting toolbox that I don’t have on my laptop. Also there is a mapping toolbox that may do what you want without having to use google earth.
Thank you for that Pete,
Could you please be so kind and make this into a simple “for dummies” format for me. For Example:
Step 1: open mission planner
Step 2: convert log file to Matlab type file
Step 3: open Matlab
This way I will understand. Maybe you have really watered down the steps to make a noob like me get it, but honestly it’s still hard for me to digest which is why I ask for a step 1 step 2 scenario. I’m sorry to push your patience. Once I go through the steps I can message you and let you know if everything works or if there’s any errors. And again I’d like to say that I’m paying for your assistance. Once this is sorted I can message you directly for payment details. Can’t thank you enough mate you’ve really helped me out