I have been performing some sonar mapping (bathymetry) with an Ardupilot controlled boat. The sonar I use is a cheap Deeper Prop+. The output data is in csv format. I have downloaded the free ReefMaster demo (14 days) and have generated some nice 3D maps, however at $200 this software is beyond my budget. Does anyone have any suggestions for free or cheaper software that can generate a 3D map with LAT/LONG/DEPTH in csv format.
I work at a golf course in Shenzhen China. I want to measure all of the ponds water holding capacity. I purchased the Deeper Pro+ and I was wondering what boat you are using? I dont have experience with Ardupilot.
I wrote some code in python to read data from a .csv file, compute averages, and plot contours. Basic plots, as well as .kmz files for Google Earth, can be generated. I put all the code on my website. Many thanks to @greenalastair for sharing his data!
This is a work in progress, and I will post updates later on. Please let me know what you think!
Hi! Kogger team has some features for export their sonars data to CSV. I am a developer there and can help with improvements. Open source viewer and export app https://github.com/koggertech/KoggerApp .
I highly recommend qgis opensource software
Load the csv as delimited text vector layer
X is longitude
Y is latitude
Add Google or bring maps
Way more functionality than reefmaster, but a bit more work to learn, totally worth it.
I use Global Mapper for lidar, but it’s pretty much the same for importing CSV points and creating a surface. Like Paul said, Qgis is free and very capable as well. I was actually a little surprised how cheap Reefmaster was. If it was for the lidar world it would cost 10 to 15K easy with crazy expensive yearly maintenance contracts lol!
I have used QGIS for this application and also recommend it. I have a rpi on my boat that gets location from the FC and depth from an NMEA 0183 device. My boat saves the data to github in real time or as wifi is available, in the geojson format (which github can preview and is easy to import into QGIS). The repo has lots of test data and some runs, it’s been a while since I did anything with this though.
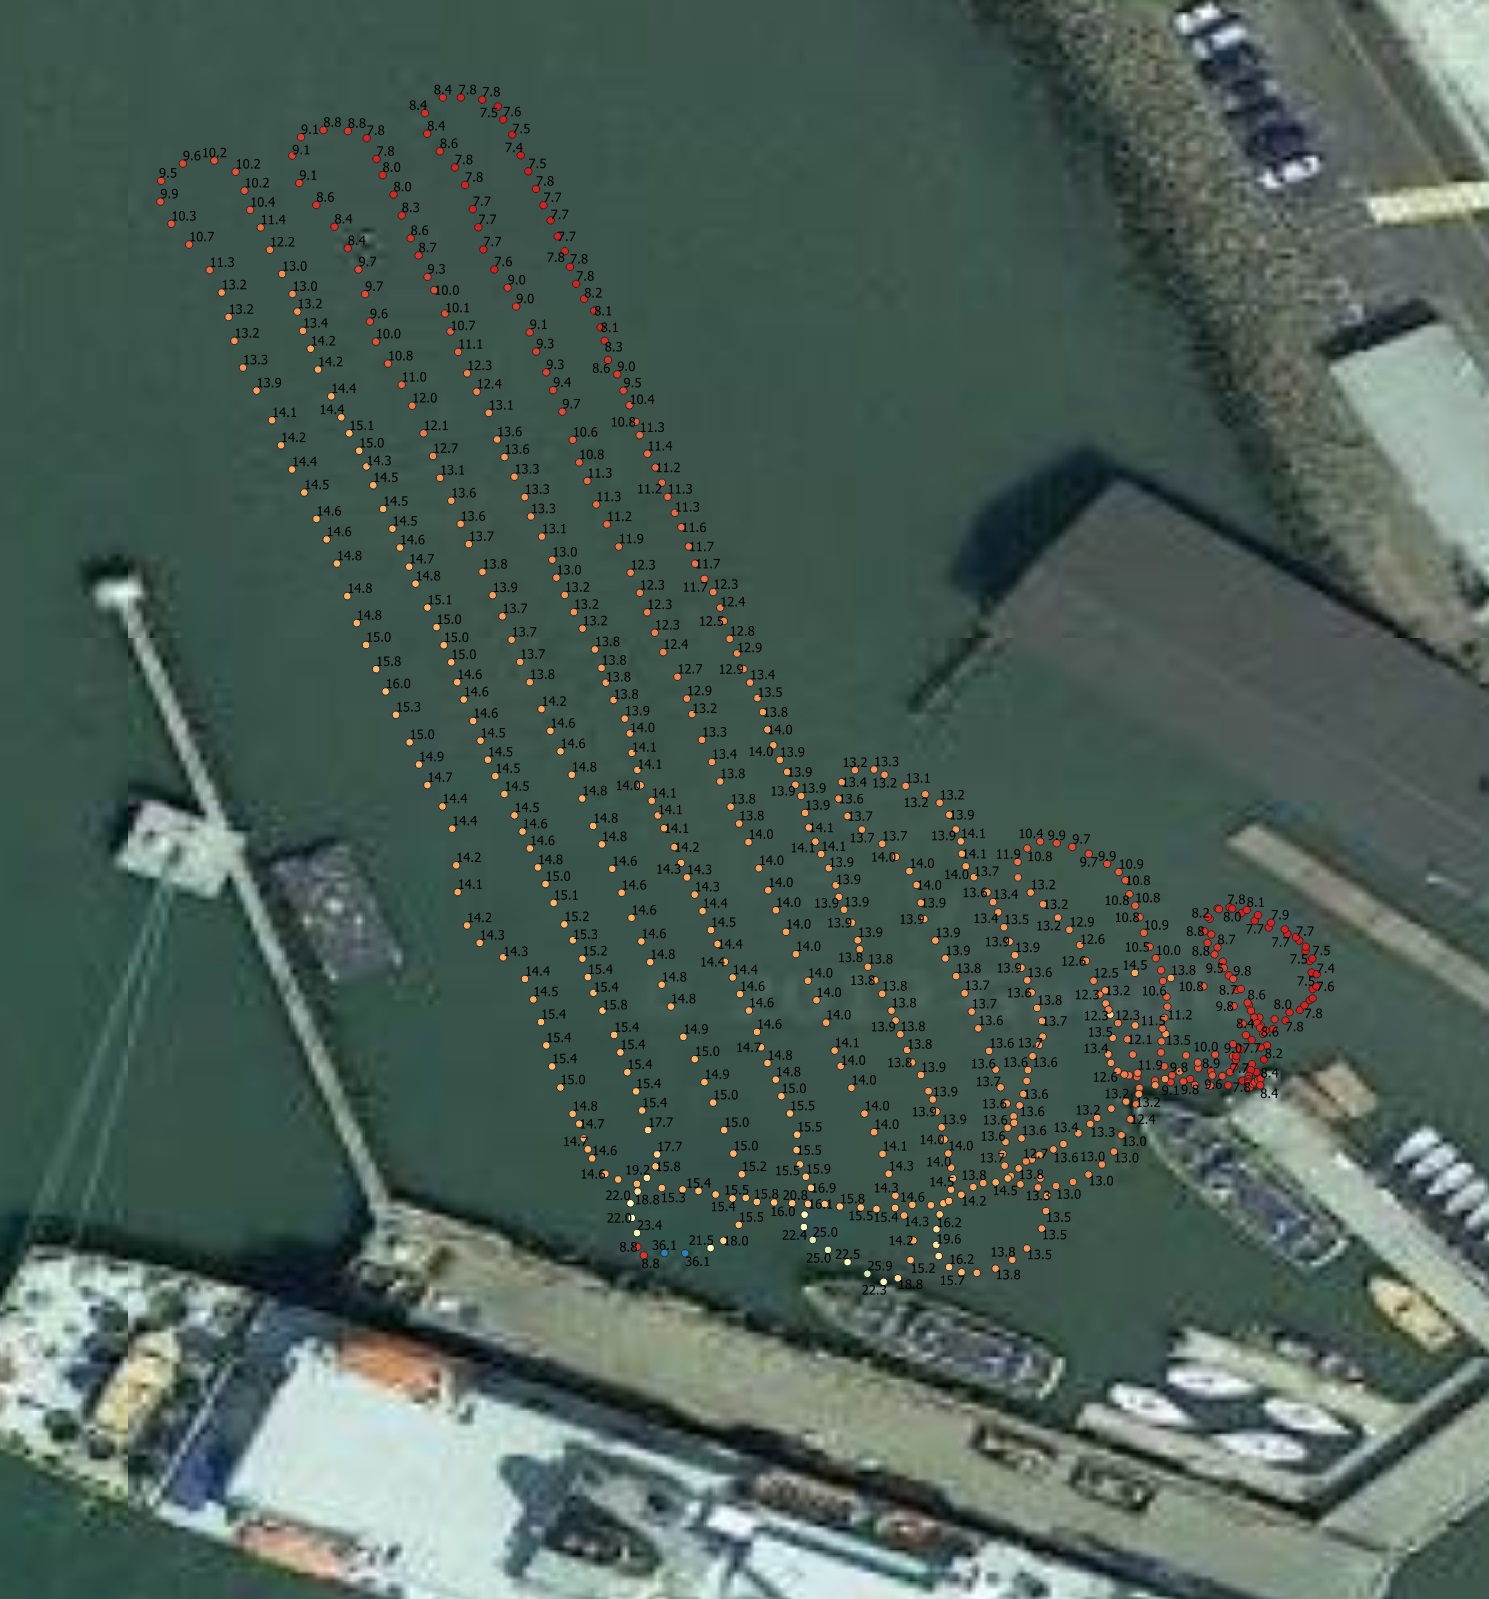
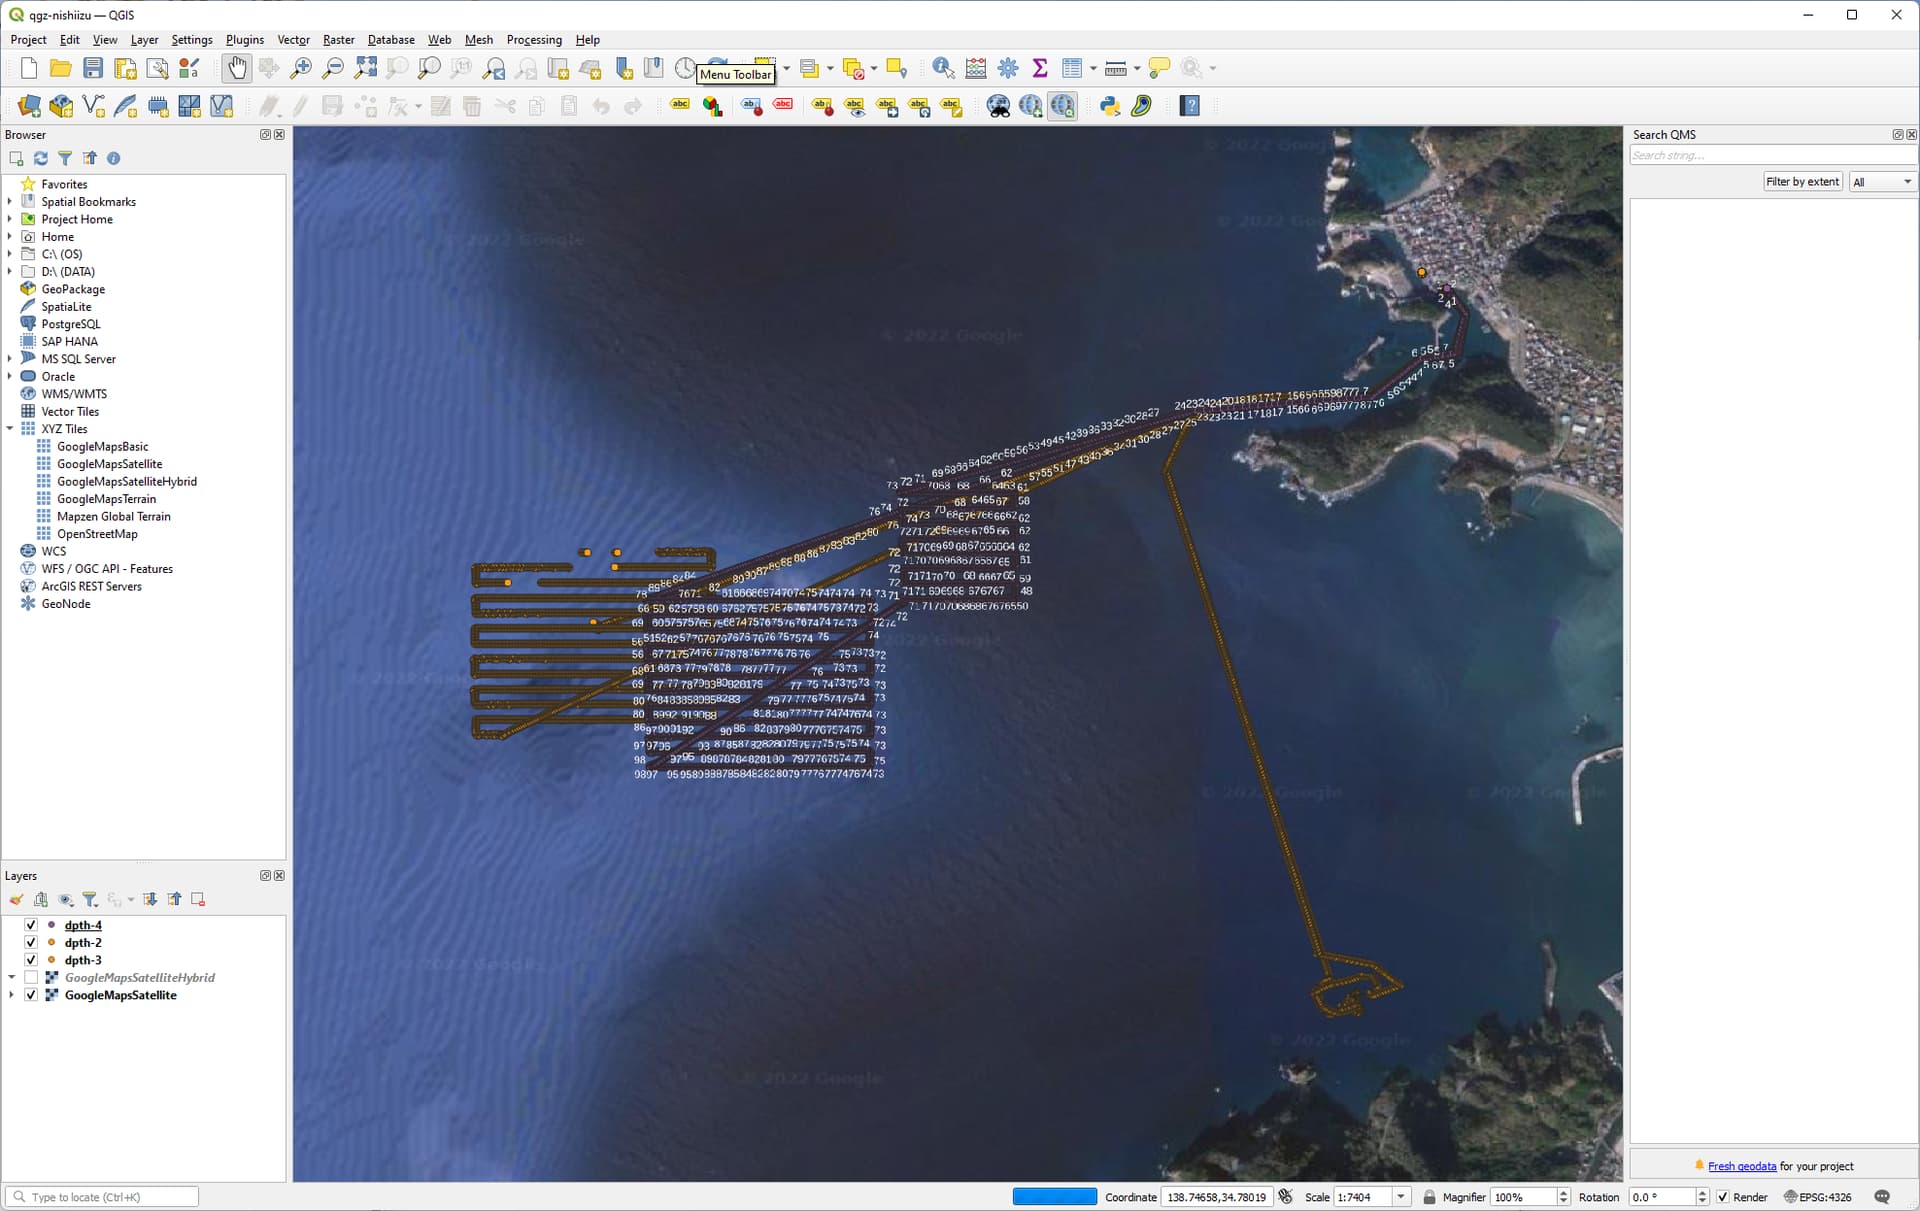
But back on topic, importing the data into QGIS is easy and you can do powerful visualization. Here is some depth data from Cal Maritime’s harbor in 2019. Depth in feet, labeled and colored.
Way to go Mike - thats brilliant ! geojson i didn’t realise was rendered so easily by github and mapbox. So much to learn, and so many opportunities.
Im on the learning curve - but QGIS and its community is really mature, capable and fun. 3d Mapping our local rapids
Hi Paul, it looks great! If i understand you correctly you did this 3d map with qgis? If yes, have you some more infos for me how to do this? Thanks greets eddie
Hi Eddie,
I’ve just started using QGIS but found it amazing - and so powerful. Great community.
The 3dmapping stuff was done with a plugin qgis2threejs - then found a free hosting service to serve it
Thanks for the suggestion re QGIS. I’ve just downloaded and started playing around with it.
I’d like to make the equivalent of this wiki page for Reefmaster to help people get started creating 2D and 3D maps with QGIS. Any advice is greatly appreciated.
I’ve got as far as importing my 3 depth files using Layer, Add Layer, Delimited Text Layer and next I’d like to map a google-map like view appear on the screen as well and then turn it into a 2D and/or 3D map.
Way to go - you’ve done the hard part.
Yep - im happy to have a bash at a Wiki page with a couple of caveats - its how i use the tool, and probably not the best way to use the tool… - and may need some help formatting to wiki standards.
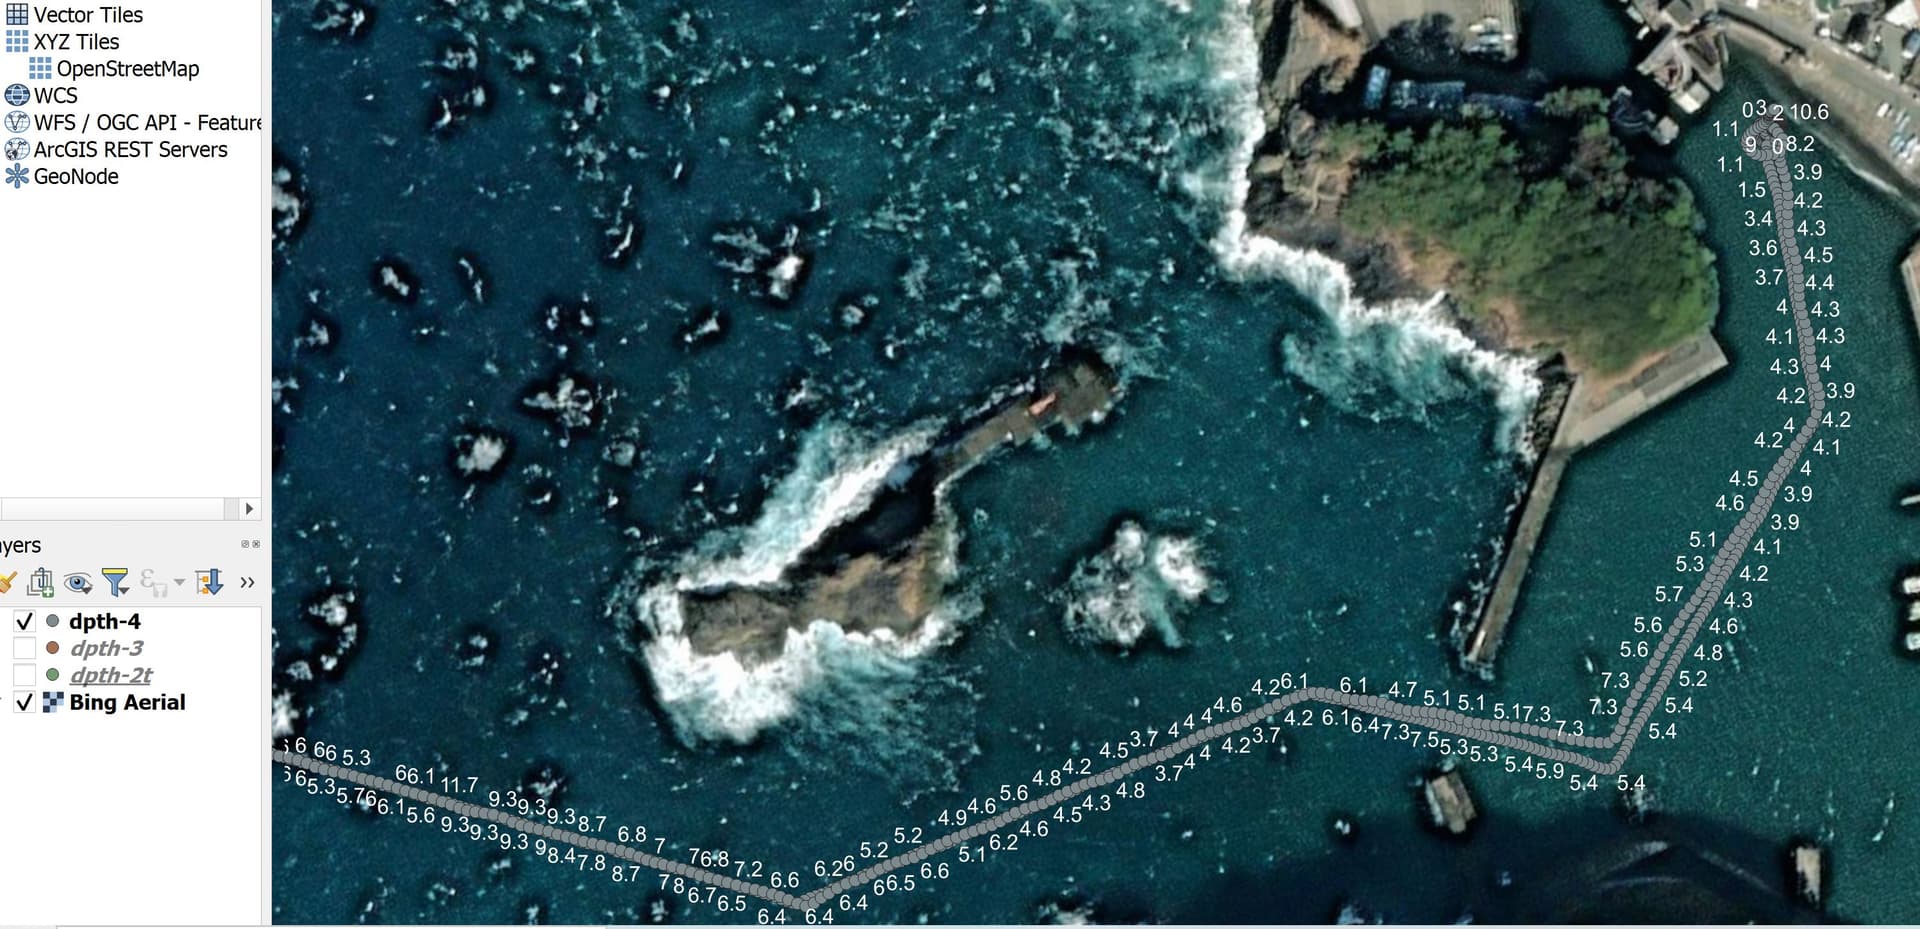
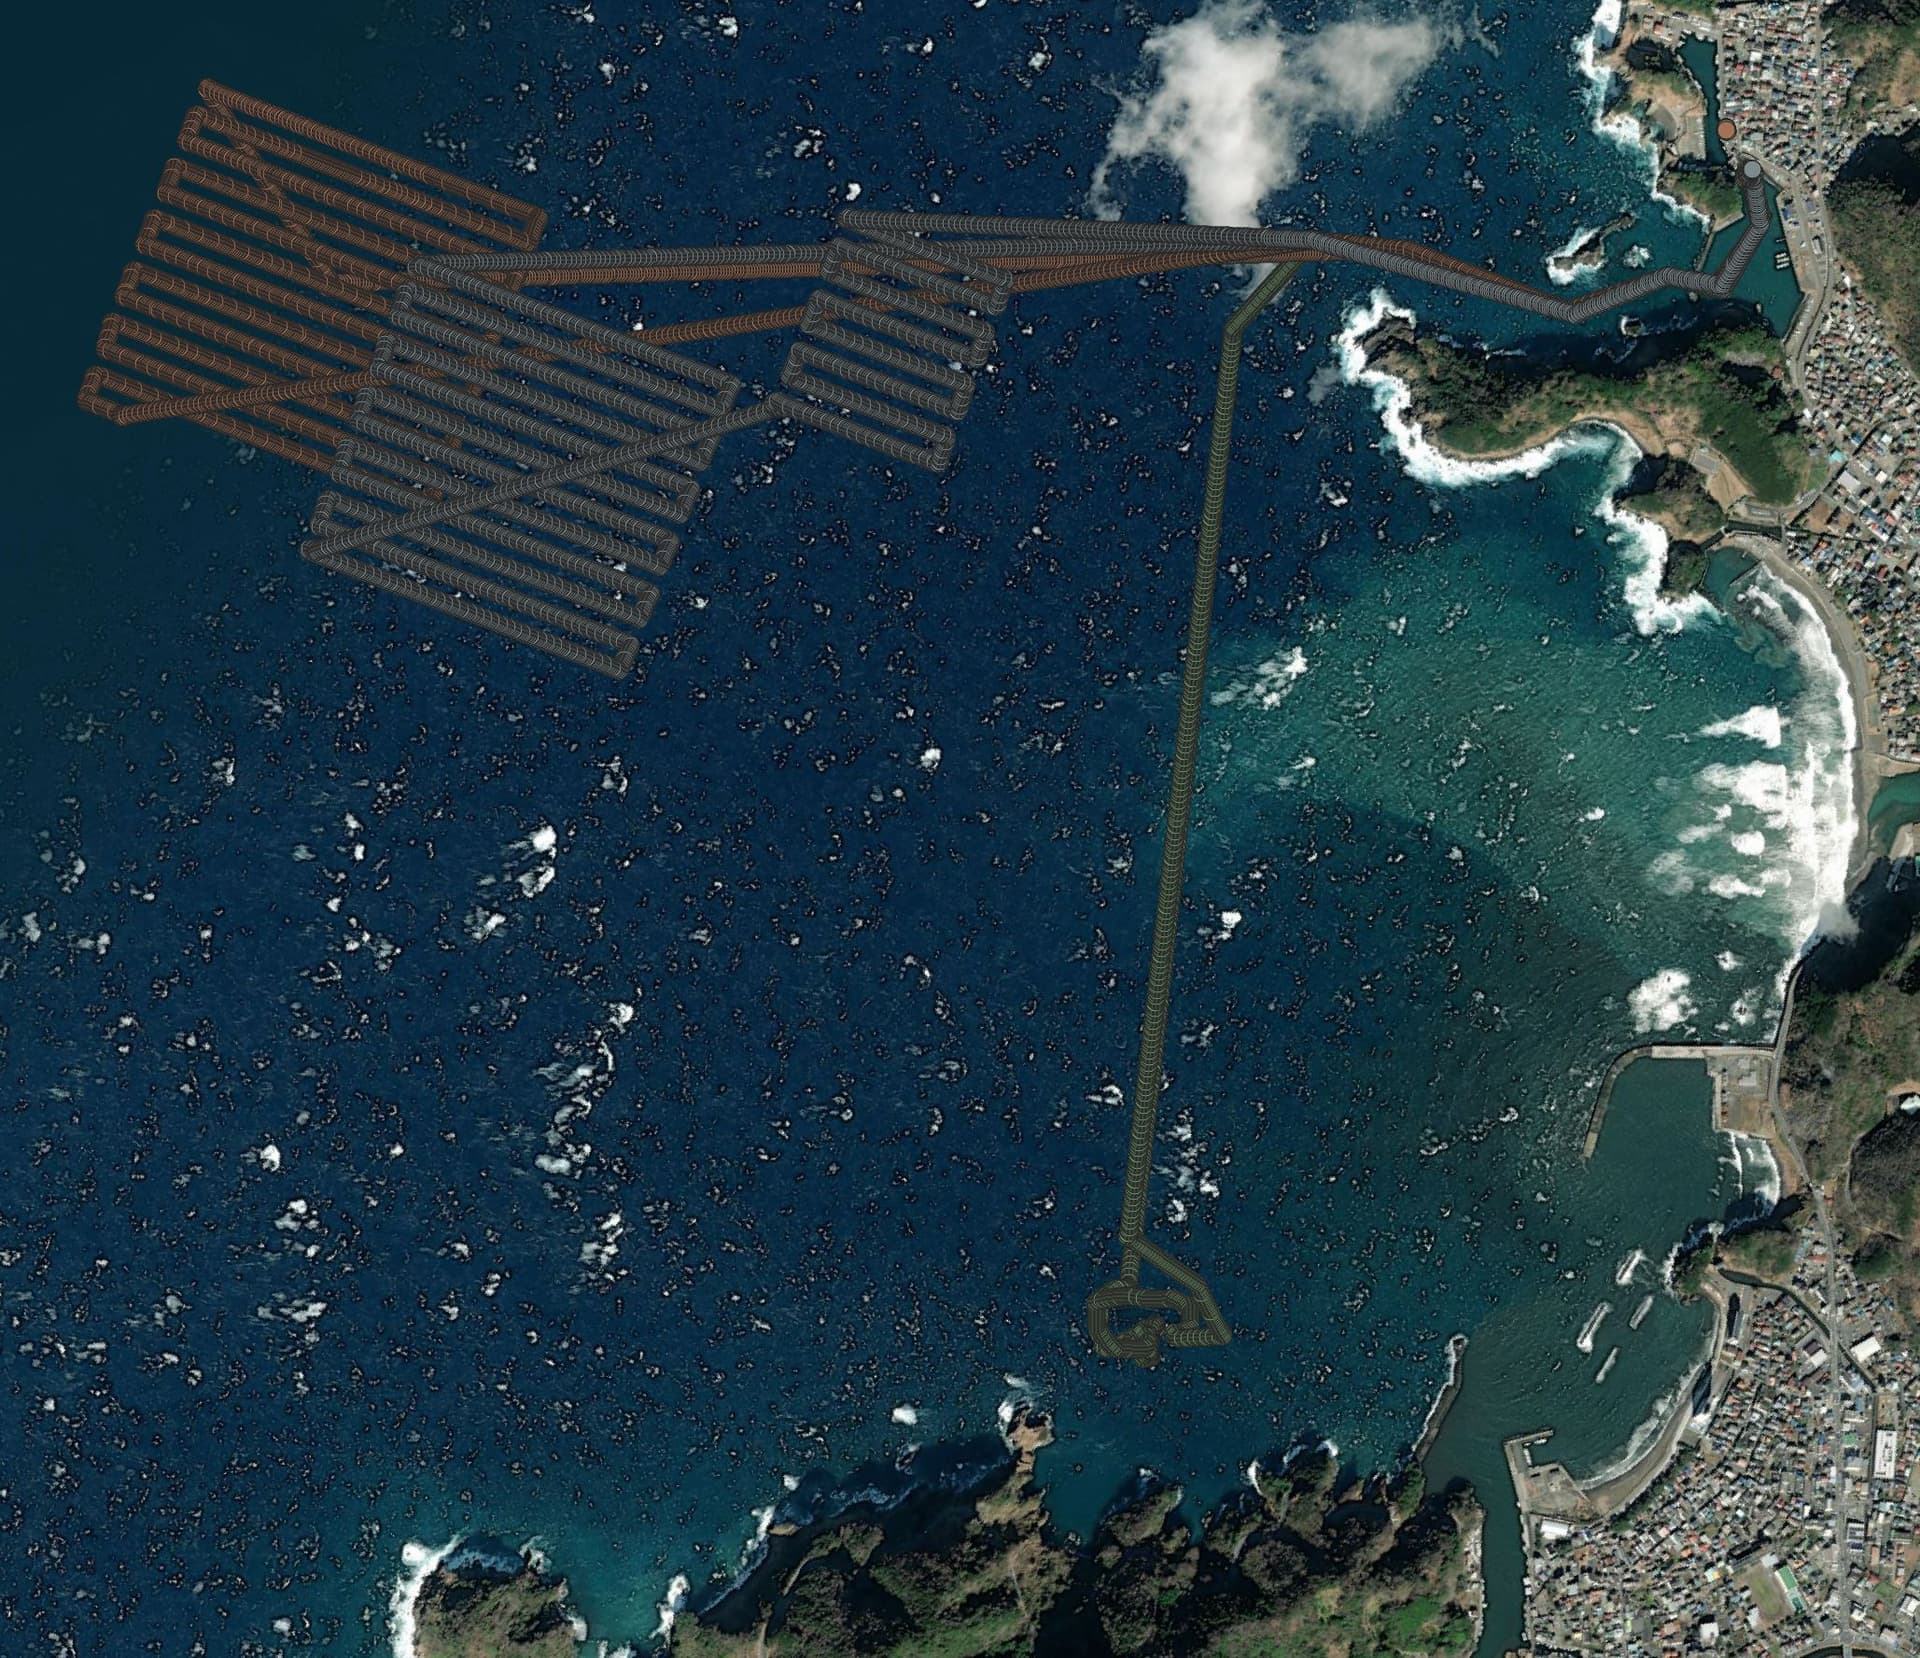
I pulled down your dataset - added Bing Maps (i had it handy) and it overlayed your data.
Created a spatial index (speed things up) then added a single label for depth.
QGIS plugins are amazing. QuickMapServices allows you to search for basemaps - google,bing etc and add then as a layer. I have a QMS Search button to bring in the basemaps - i’ll document getting that working.
Generate Dataset
Process the log files into CSV lat,long,depth
QGIS add a layer
add a basemap
label layer data eg depths
generate bathymetry
add topo lines and depths
make it pretty
move it to 3d with qgis2threejs and export to web service.
Yes, I’m totally happy for the data to be shared and I can certainly help lots with putting it together on the wiki.
There were a few places in one of the files where the speed of the vehicle went too high and because of where the sonar is mounted it produced some crazy irregular depths. I’ll chop those out and re-post some fixed files. That will take until my Saturday though because I’m off testing (a rover and a multicopter) tomorrow.
Anyone looking for an alternative to reefmaster should look at BioBase, it’s free for governments and non-profits and is a powerful tool for mapping including mapping aquatic vegetation and bottom hardness. You would need to have a Lowrance/Simrad (Navico) fishfinder that can save sonar logs on your boat. in
I’m building a boogieboard UAV for this purpose using a Pocketbeagle and hopefully the onboard routing/gps of a Simrad GO7 NMEA2000 network. Here is a vegetation/depth map from Lake Owasso in Minnesota:
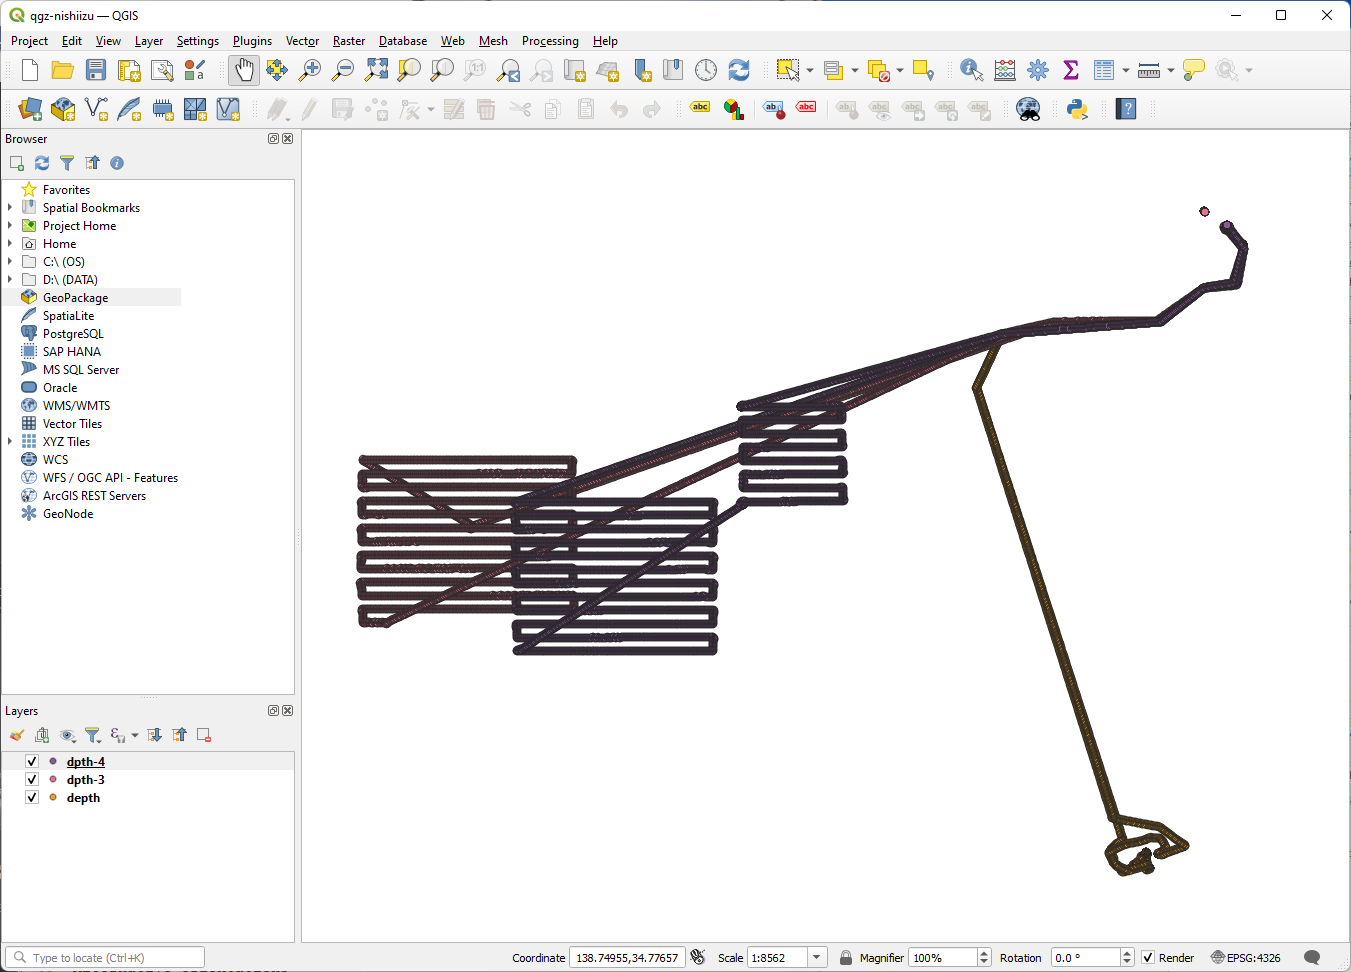
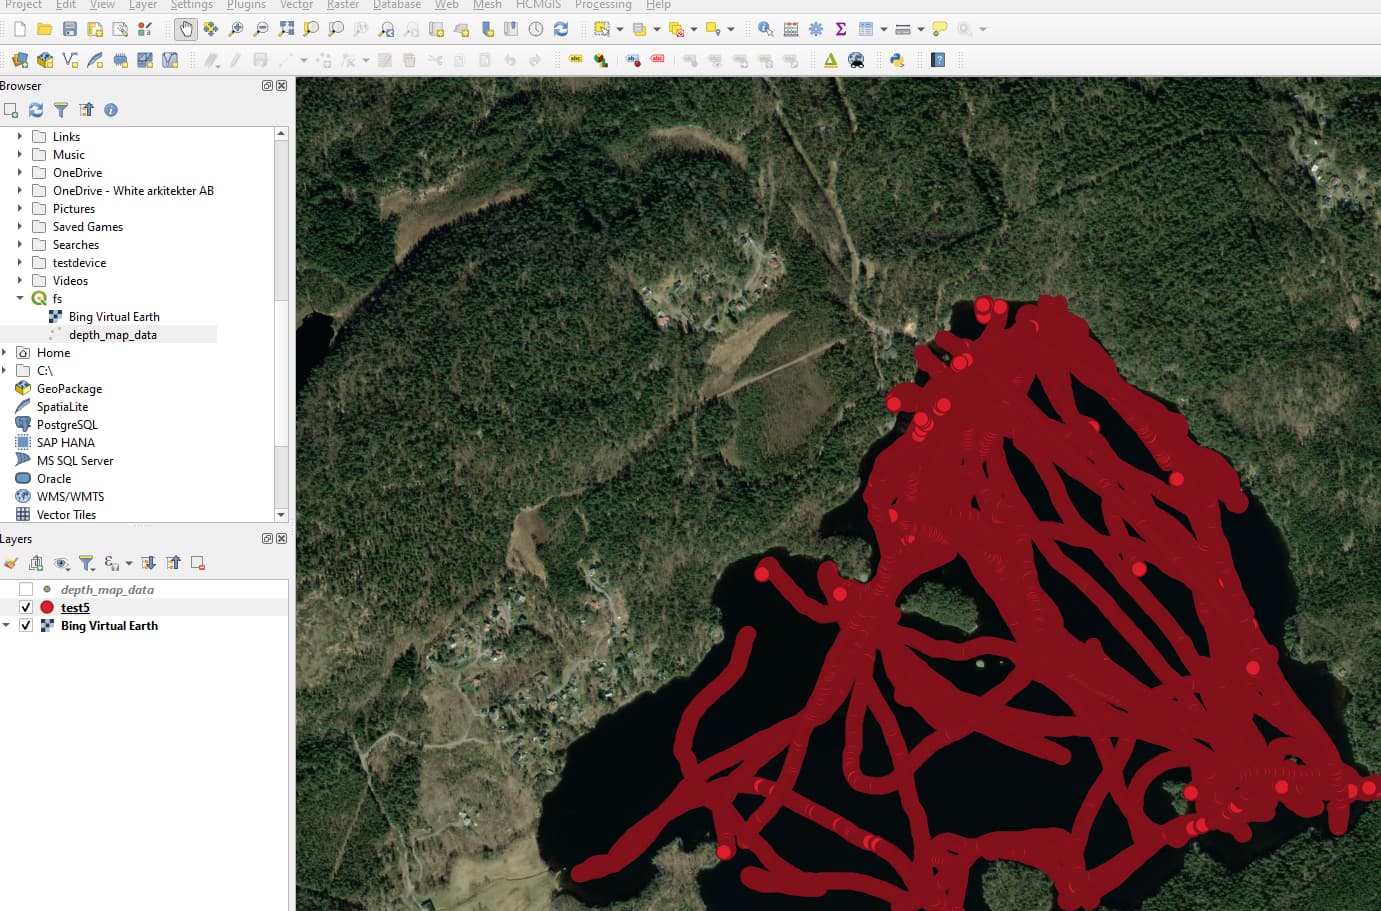
Found this thread and this is exactly what I have been wanting to do for a long time. Installed qgis and imported my x,y,z data. So far so good. But the result looks bad and there are issues with elevation. My qgis skills are non existent so maybe someone can help me out here. Or if you @kiwiPaul has some other tips. I would be happy to share my data if someone could save a qgis file that I could start with. Thanks in advance.
edit: most data end up in this Swedish lake but there is also one dot appearing outside Africa. Not sure why?
Fredrick - It iooks like you are almost there!.. have a look on page 9 of my little writeup of our mapping project doc, it has the fields i used to get the x,y,z data working in qgis. Give that a try, or send me a link to your dataset and i can have a play around to get the depths working.
ps - like ardupilot, im finding qgis is a gift that just keeps on giving. Its excellent, and getting better (but has a steep learning curve)
Thanks @kiwiPaul . Your work looks great.I could not really understand how to get the fields on page 9. I know a lot of data is missing in my lake and hopefully I will be able to get more data this summer. This is what I have so far.