Nice work Fredrick. Interesting part of the world
I tried on my laptop - that didnt work at all, kicked my son off his gaming pc, it worked much better !
i added headings to the csv data latitude, longitude,depth and removed with an editor eg notepad++ the 0,0,0 data entry approx 28000 rows down ( that was your africa datapoint)
in QGIS new project, add layer, delimitered text and set the following…
the next question im guessing is - how to get contours and 3d type imagery - roughly, from memory
a) add in polygons around the wateredge - with depth=0
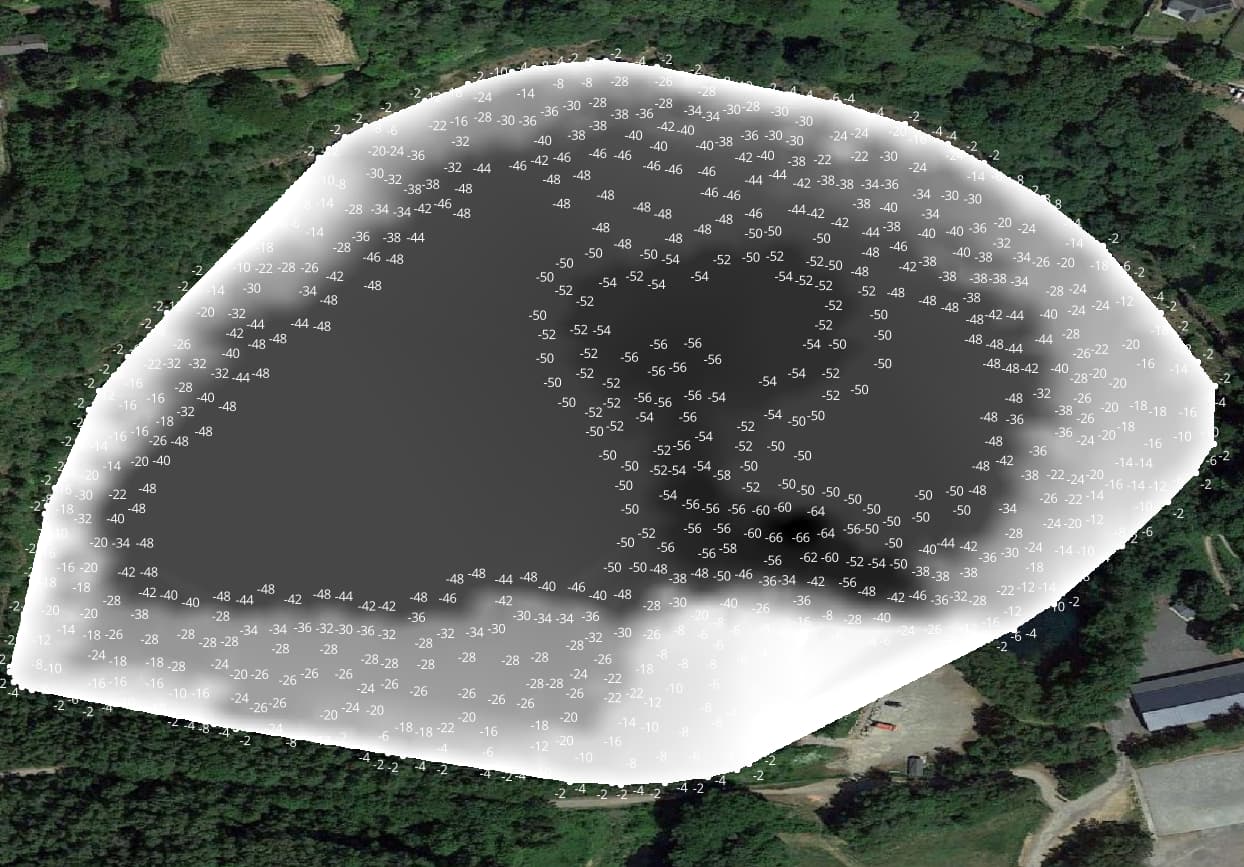
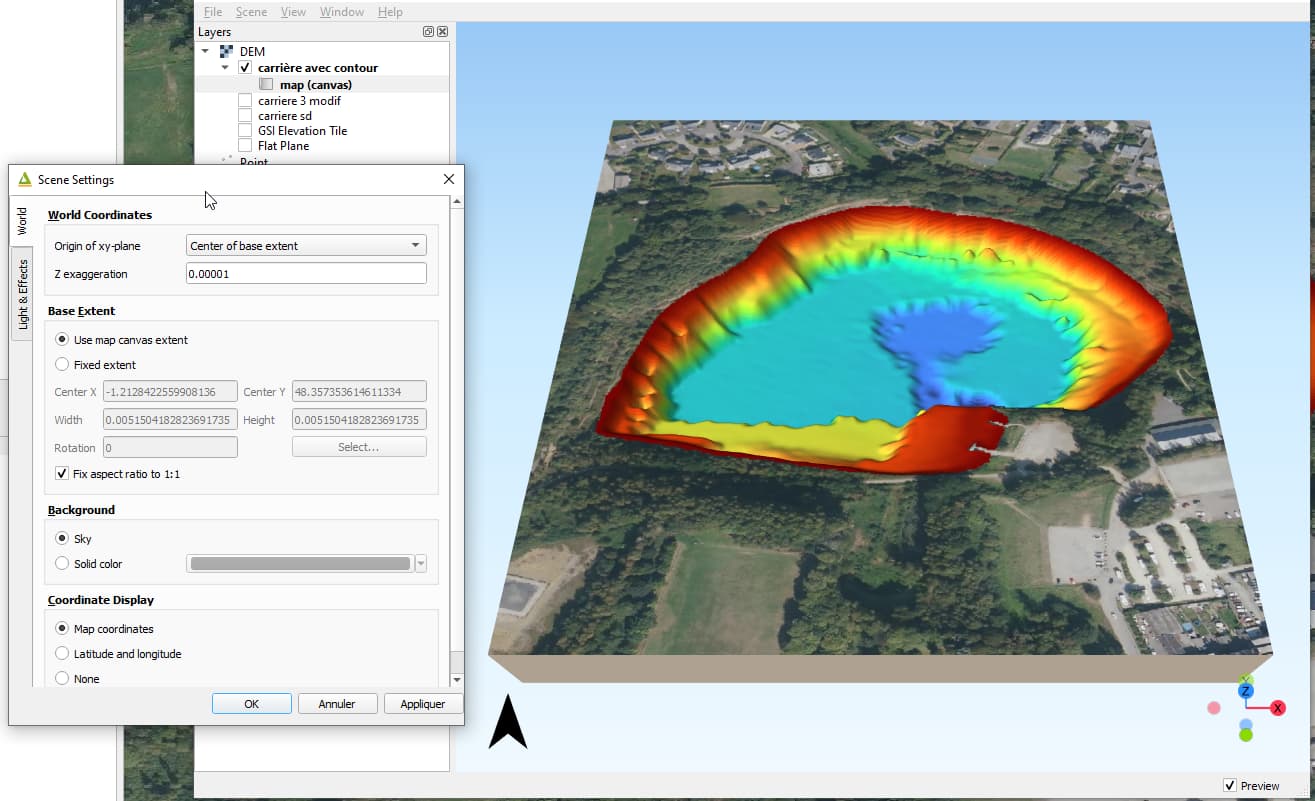
b) use the qgis processing toolbox - interpolation tools, and
do a TIN interpolation, using depth - it creates a grey scale of the region selected
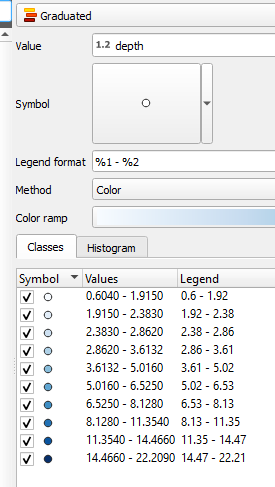
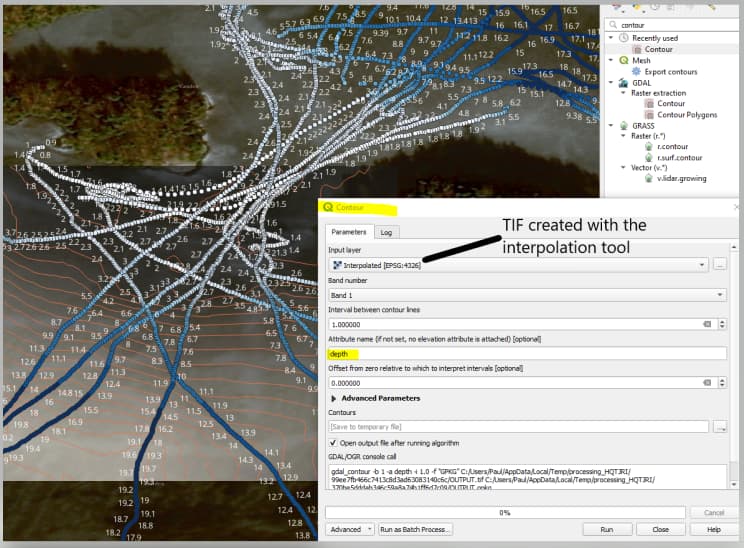
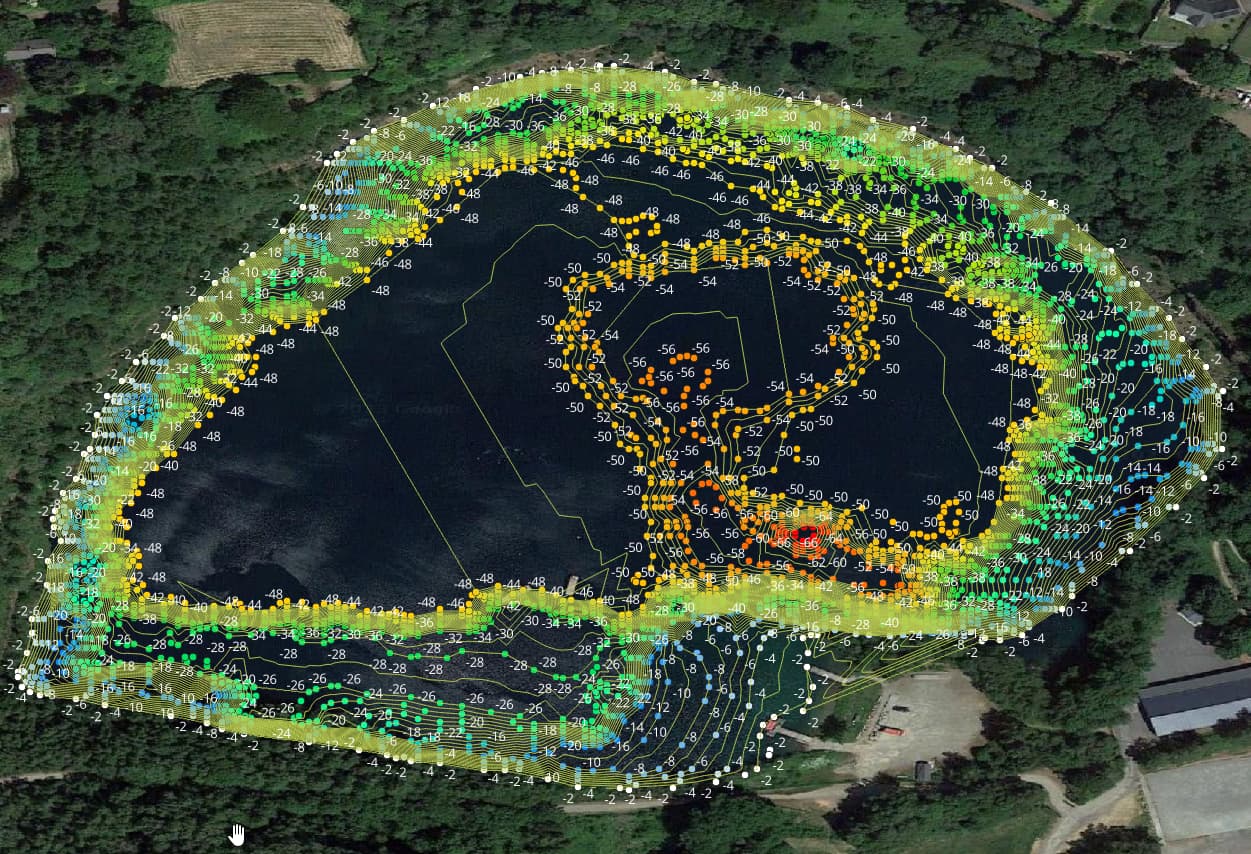
c) use the interopolation to generate contours (seach contours in the tools)
I have done the bottom mapping of a quarry with Reefmaster and I am now trying to do the same in QGIS.
I tried to follow some instructions given above, but it seems that i can’t find the “page 9” of the writeup mentioned above (I have read the google presentation).
I tried to export my Reefmaster project waypoints in a CSV file, but it exports multiple objects as isobaths shells, Major contours and minor contours.
I have filtered csv lines in order to keep only lat/lon and depth values for major and minor contours.
Then I opened QGIS and followed these steps :
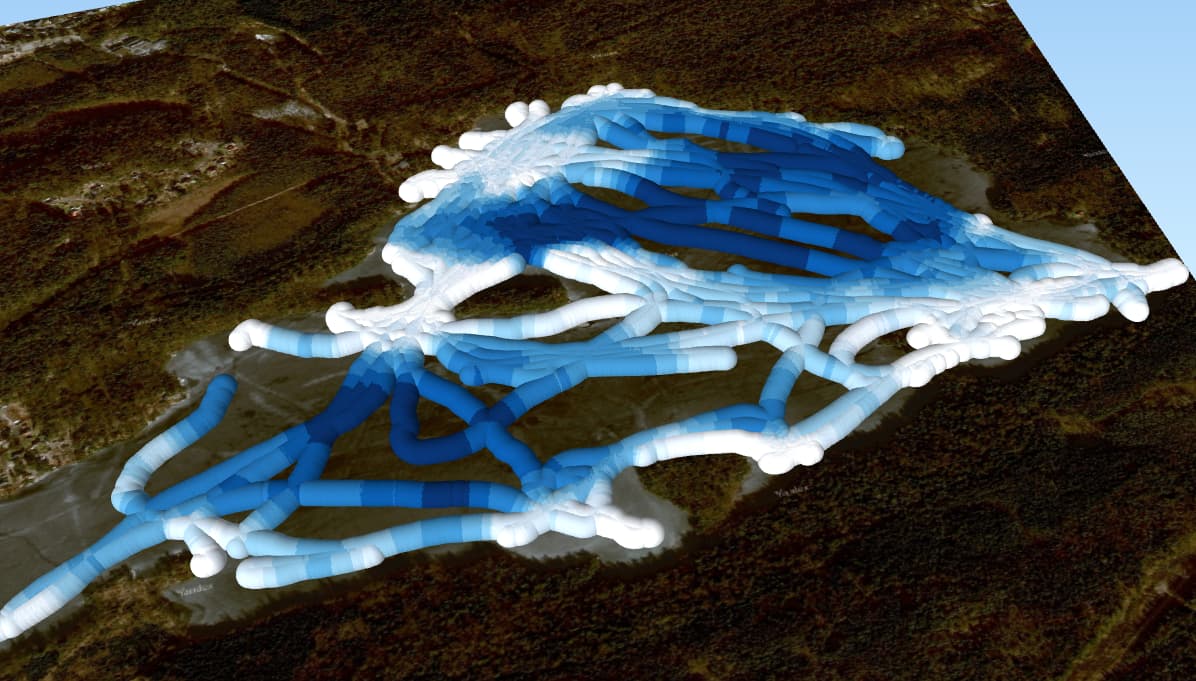
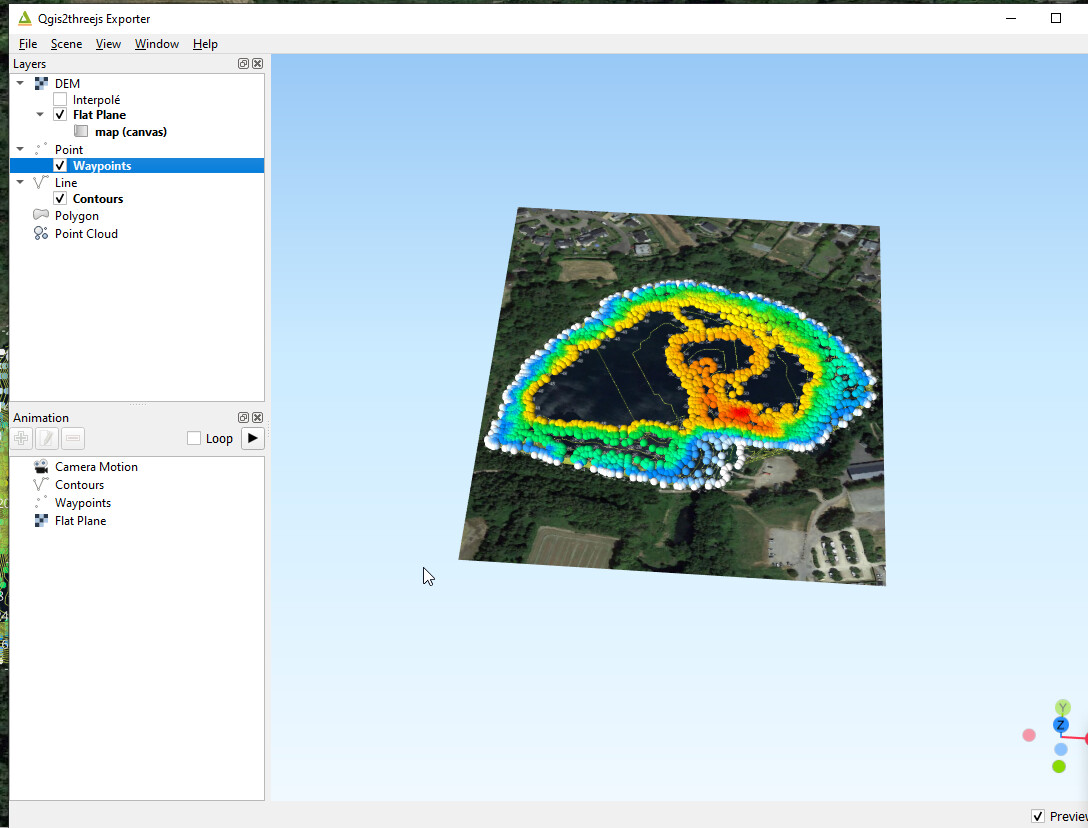
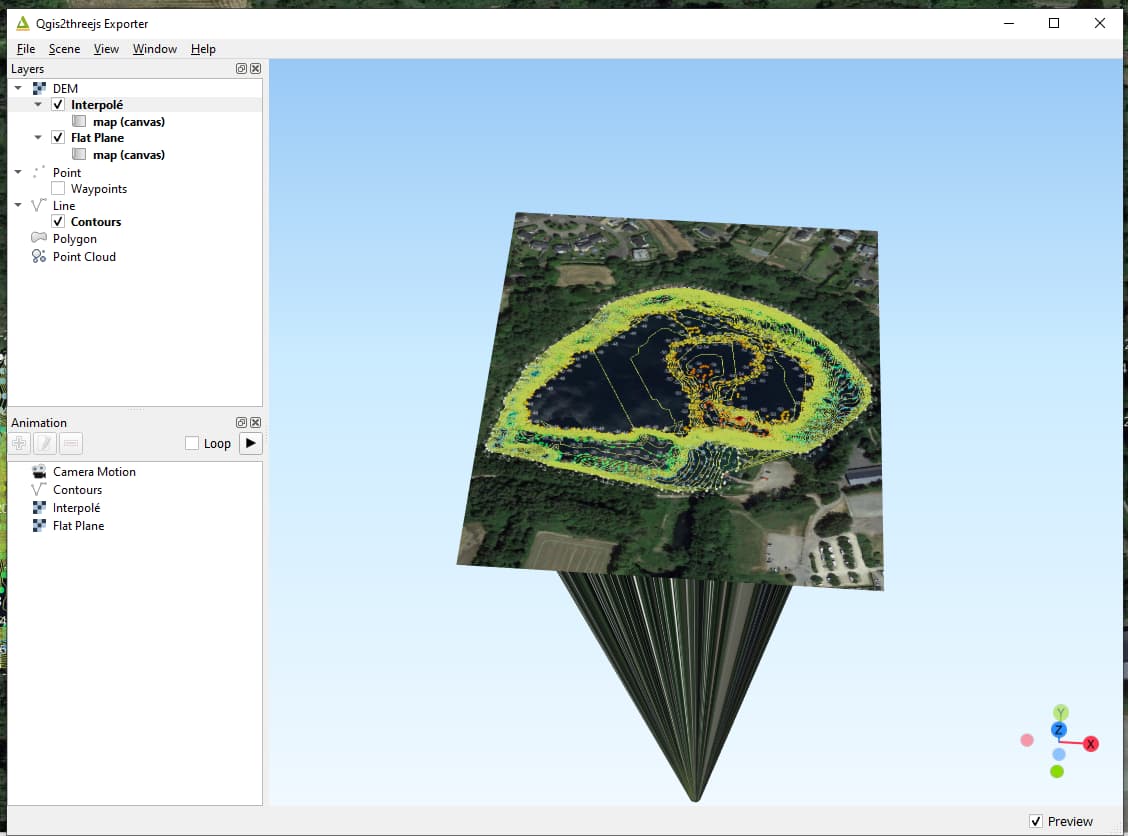
Then, with qgis2threejs I can obtain the same image as step 7 above, with “coloured” ball waypoints, but I can’t obtain something like a 3D object with contours, because it generates some weird depth values… (seems unlimited or with a ponderated value…)
PS: From reefmaster, I didn’t managed to export “manually added” contours and depth points (in order to adjust surface limits in shallow water)
If someone has a clue on how to do that, it would be great too.
Nice work, i got the same results. - so close to useful.
Its worked for me previously, but seems the qgis2threejs has changed a bit in the year since i last played with it, no obvious way to add the depth component - or at least, its different, so a bit more learning…
I’ve had similar problems in the past with the depths being text values - so look right - but arent able to be used as we want. Any text in the data field can throw it - but im thinking thats not the problem here.