As you may know I have been working for quite some time on Heli autotune. It has been journey of learning, first on how to do this in the frequency domain and then what makes a good tune. I have had the opportunity to working on a manned helicopter program where we looked to predict the feedback gain (what would be the PID rate P gain) that would maintain 6 db gain margin to the instability. I worked from analysis that was provided to me without truly understanding the underlying theory. Recently I was looking into pilot induced oscillations and came across the same theory that was used to determine the feedback gain. After looking into this this further, I figured out how this theory could be applied to autotune to predict the closed loop response and hopefully minimize the time it takes to tune vehicles.
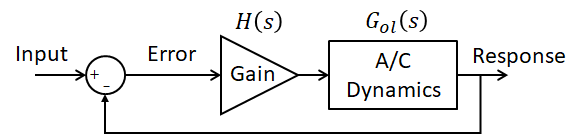
First let me explain open loop and closed loop. Open loop is when the vehicles response is not being used to modify its control. It would be like flying an airplane with no stabilizing electronics. Essentially using only the RC receiver to make inputs into the control surfaces. Closed loop is when the vehicle response (angular rate, attitude) are used to help stabilize the vehicle. Here is a diagram of a simple control system where the aircraft response is fed back into the control of the vehicle (closed loop system)
The open loop is between the error and the response where as the closed loop is between the input and the response.
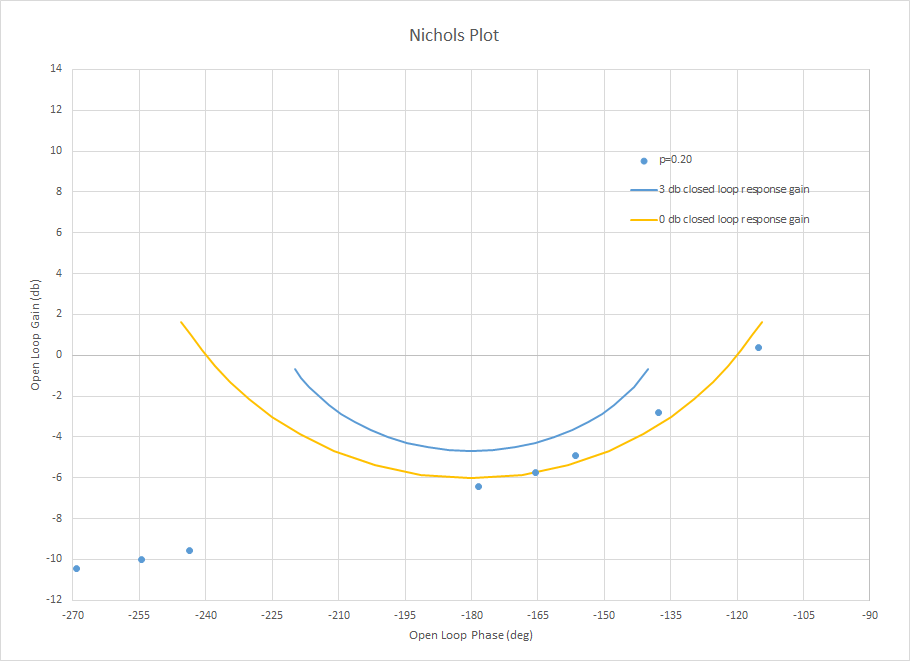
We can use a nichols plot to move between the open loop response and the closed loop response for this simple system. The nichols plot for the yaw axis of a helicopter is shown below
The blue dots are the frequency response of the yaw axis. Each point is a dwell at a frequency and the resulting open loop response gain and phase is plotted. The lines overlaid on the plot are lines of constant closed loop response gain. You can see the 0 db and 3 db closed loop response lines. It shows that the current Rate P gain setting of 0.2 has the closed loop response peak gain a little greater than 0 db, maybe 1 db. With this plot, I can now predict the Rate P gain necessary to achieve a closed loop gain of 3 db by measuring the change in gain between the data and the 3 db closed loop line. Changing the Rate P gain just moves this data up and down on the plot. So you just want it to touch the edge of the 3 db line.
Thus we increase the Rate P gain by 1.35 db which is multiplying it by 1.16 and the new rate P gain would be 0.232. Conducting dwells at several frequencies and plotting the resulting data you get
You can see that the closed loop response for the new Rate P gain touches the 3 db line
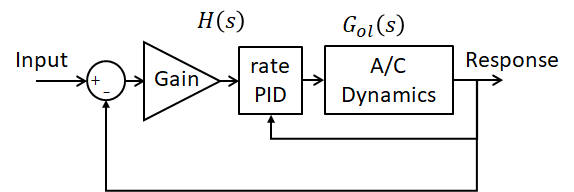
This simple close loop system is identical to the attitude controller in Copter, except the rate controller is in there and would look like this
Therefore this analysis technique will work well for the tuning the angle P gain. I believe it will still work well for the Rate P gain too. For helicopter’s pitch and roll axes where the control of the vehicle relies primarily on FF, this becomes a little more difficult for the Rate P gain. I believe it can still be predicted but relies on the FF value. If the FF gain changes then it would affect the rate P prediction. In all aircraft, the Angle P gain can definitely be predicted using this technique.
Maybe I can get someone on the Plane side to look into implementing this to test it out.
@priseborough I am using five cycles to allow it to reach steady state and then another five cycles to determine the gain and phase. Those five cycles are averaged and I don’t do any calculations of the confidence of the prediction. The data that I’ve reviewed thus far has shown pretty consistent magnitude and phase across those five cycles.
Now that you bring that up, it may not be a bad idea to use something like a confidence interval to determine when a noisy signal is affecting the calculation. Maybe require estimate to be within 5% with 90% confidence? I suppose that requires that I know what the answer should be. So maybe looking at variability below a certain value to say it is good?
@Leonardthall, @iampete, @priseborough, @andyp1per
I was inspired by @iampete work on the filter tool. Also I wanted to be able to look at the closed loop frequency response after making filter changes without having to go fly it to gather data to produce the frequency response. It takes a lot of flight time and analysis to look at the effects of filters on the closed loop frequency response. So I took another stab at predicting the closed loop frequency response.
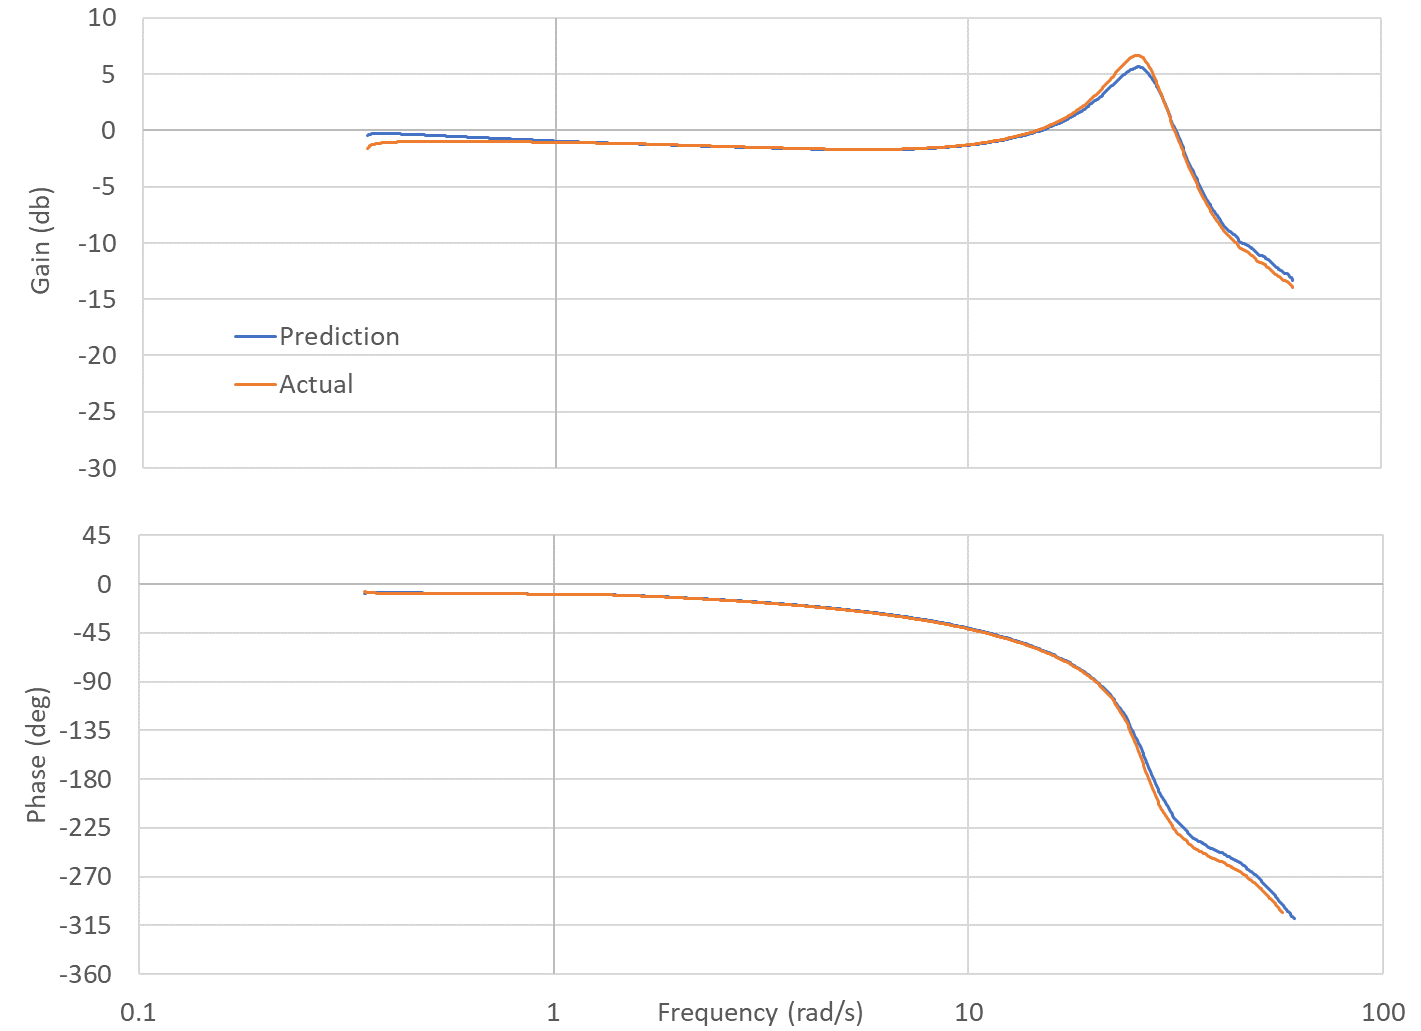
The analysis I developed takes the bare airframe dynamics which is the frequency response of the input to the motors class to the response of the aircraft. Then I developed the equation for the closed loop rate controller response and the closed loop attitude controller response. The results are not bad. I would like it to predict the higher frequency gain and phase better but it is close
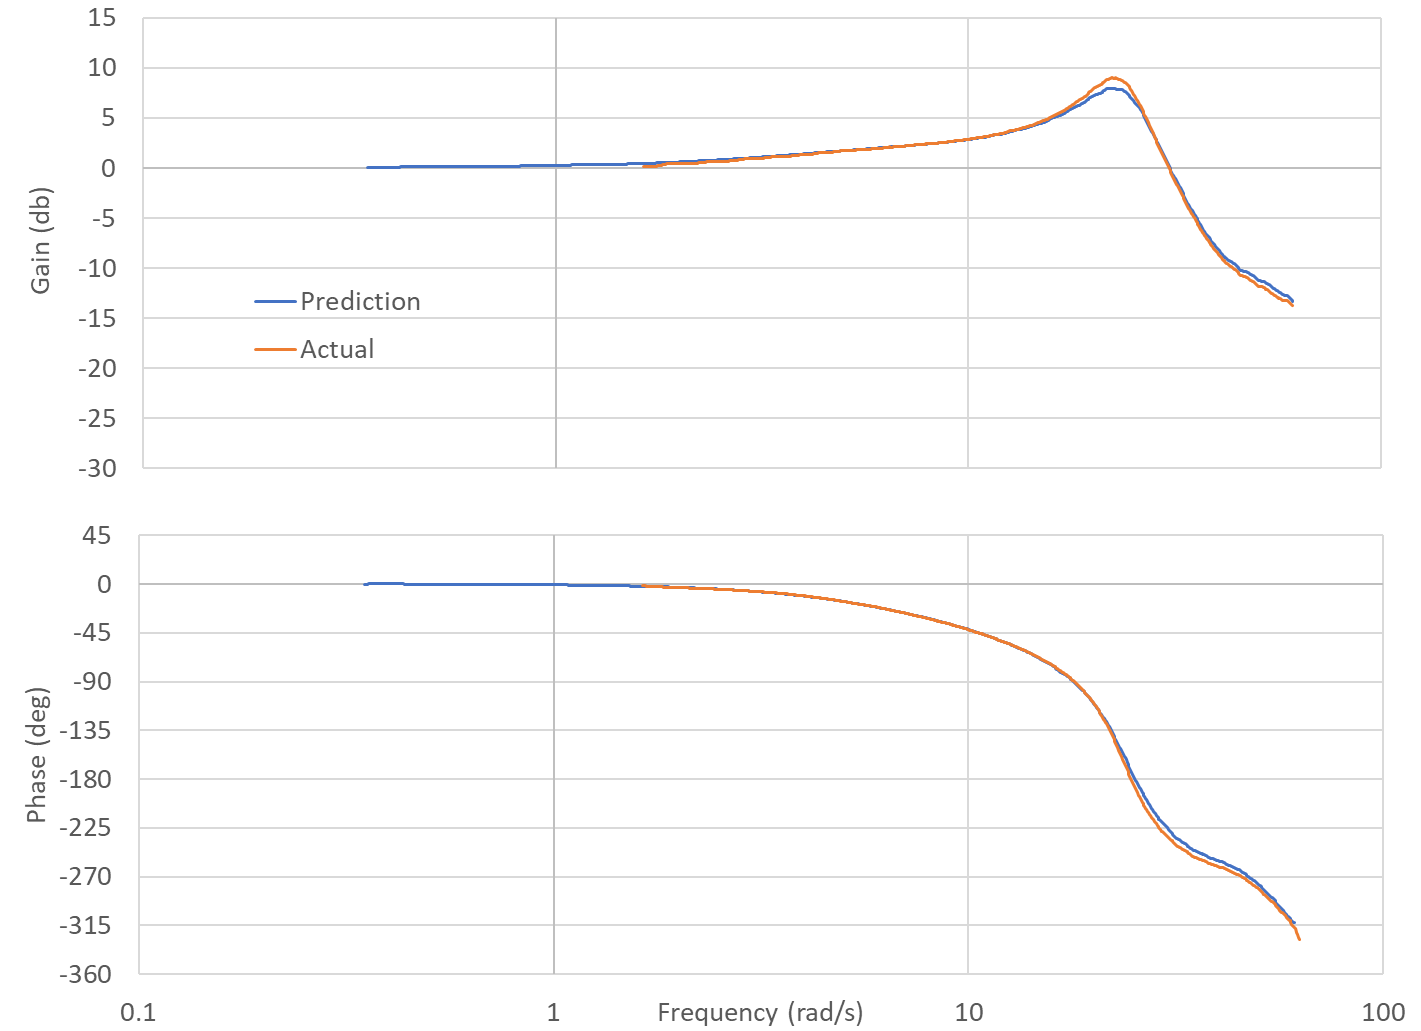
Here is the rate controller actual versus predicted. So the frequency response is taken from the target rate input into the rate controller to the rate response of the aircraft.
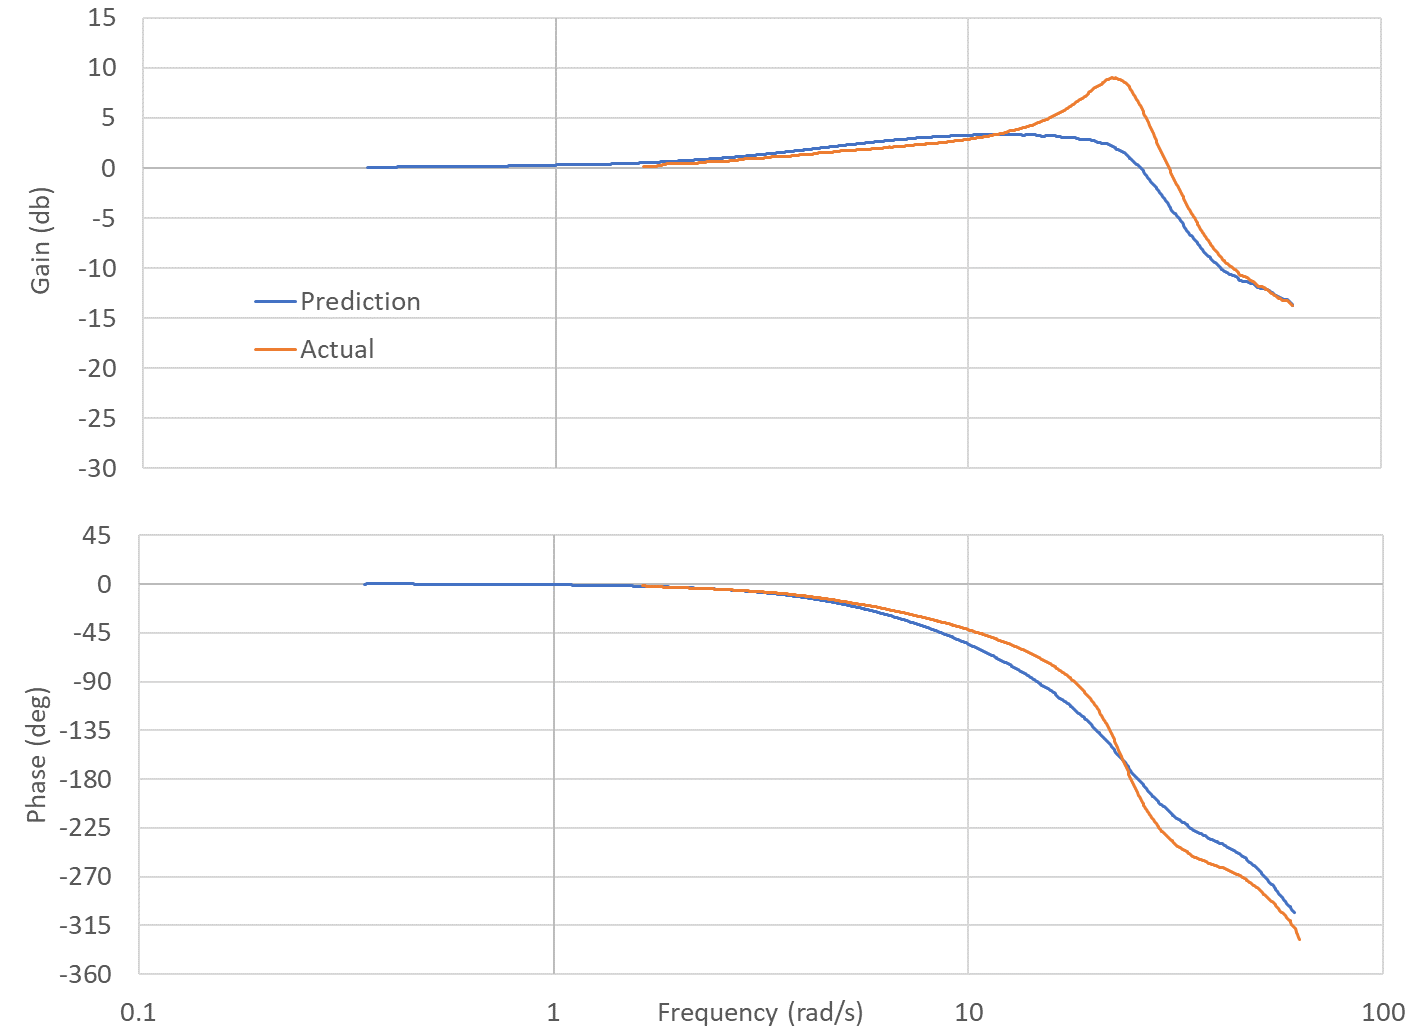
Here is the attitude frequency response prediction that includes the attitude controller but not the shaping. So the input to the frequency response is the Desired Attitude and the output is the aircraft attitude.
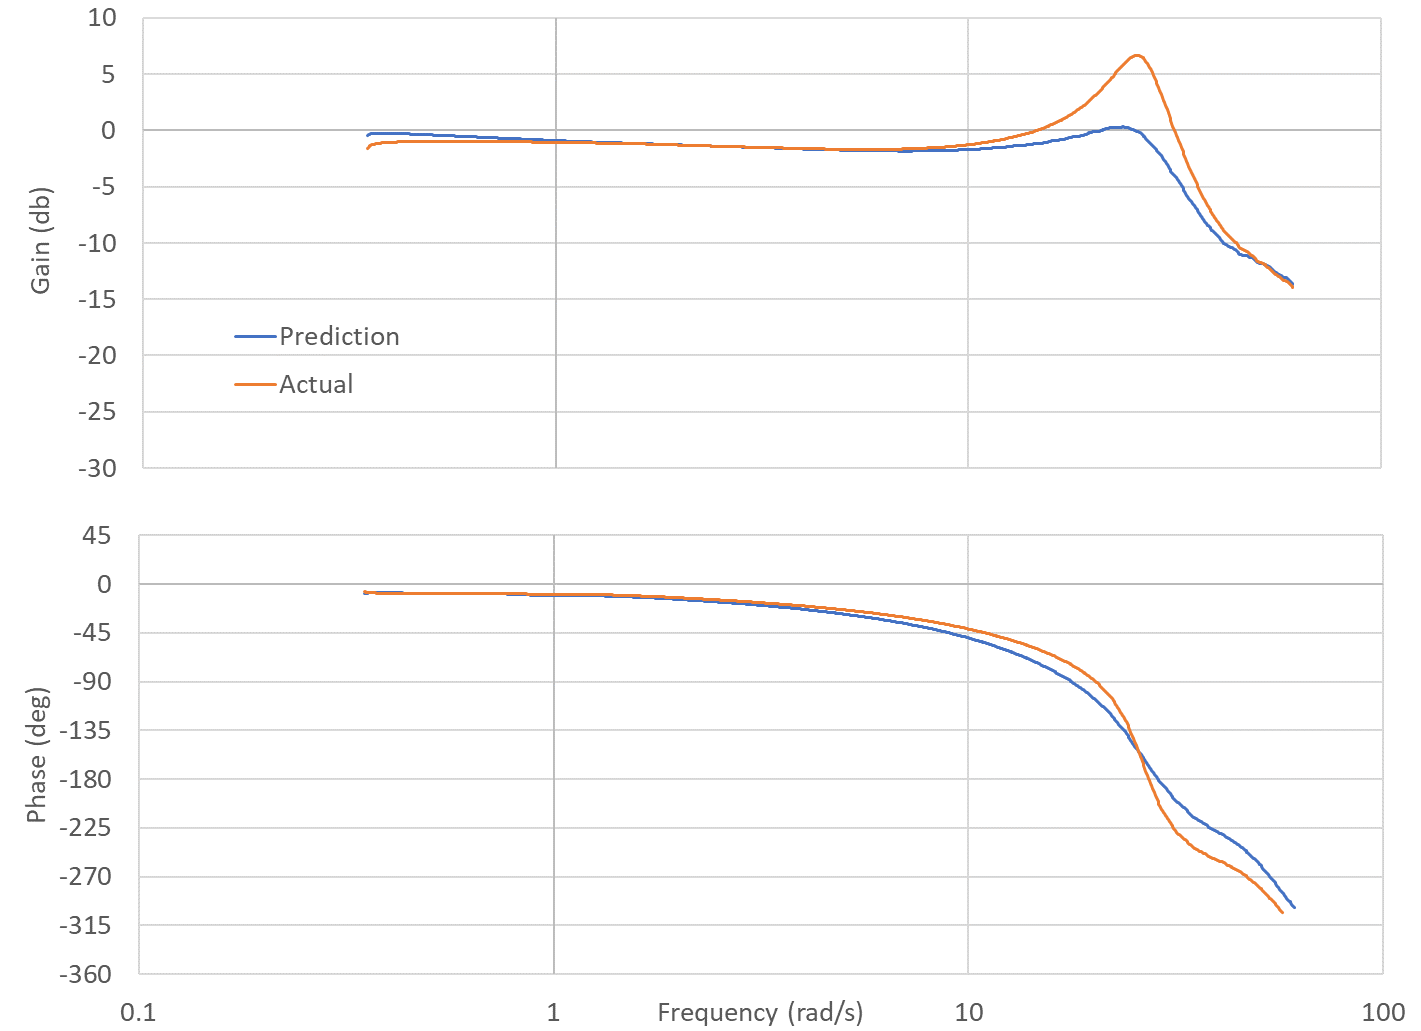
So my goal behind this was initially to be able to experiment with filters to provide a better tune but it would be possible to tune the aircraft using this tool. I haven’t done a ton of testing on it but I think it at least gives an idea of what changes could be made to improve the tune and reduce a lot of experimentation in flight. For example, I wanted to see the impact of @andyp1per PR for adding notch filters to the PID. Here is the prediction using this tool. I used a notch filter on the target and error. The center frequency was 4 hz, bandwidth was 1.5 hz and the depth was 5 db. Here is the effect on the rate response using the rate target. The actual is the actual aircraft data with no notch filters provide insight to the benefit of the notch filters
And here is the effect on the attitude response using the desired attitude. Again, the actual is the actual aircraft data with no notch filters provide insight to the benefit of the notch filters
I plan to use this to fine tune the notch filters on a heli to demonstrate their value in improving the helicopter tune. I can now do it through analysis and then go fly it to validate the results.
So @bnsgeyer does this mean that in the notch filter case the frequency response is likely to cause oscillation even without considering any resonance factors?
@andyp1per I’m not sure I understand your question. The frequency response labeled actual was without notch filters showing that heli’s inherently can have a lightly damped response. This indicated by the nearly 10db peak at rough 20 rad/s. The notch filters are attenuating the frequencies that excite the lightly damped mode both on the target (feedforward) and the error (feedback) signals. Not trying to completely eliminate the frequencies because they are near the control frequencies. Just trying to control the overshoots when making inputs in that frequency range.
Bill, this is cool stuff. Does your tool output gain and phase margin? It would be interesting to see how the proposed notch filters impact these metrics. Edit: I appreciate that you can read them off of the Bode plot, it’s just that they are hard to read off of log scale and there is that intersection between the actual and predicted phase in the region of lightly damped peak, which looks to be the area of interest.
Out of curiosity, what’s the approx size of the aircraft you recorded the flight data on?
Hi @IAMMATT. No it doesn’t specifically calculate phase and gain margin. And I am not sure that I can just pull it straight from these graphs (I.e. read phase for 0db gain and gain at -180 deg phase). Since this is not a unity feedback control system, I don’t think that is the right way to do it. From what I have read, you would need to do a broken loop stability analysis. I am working through the equations to develop the transfer function for that. I’ll post the results once I have finished.
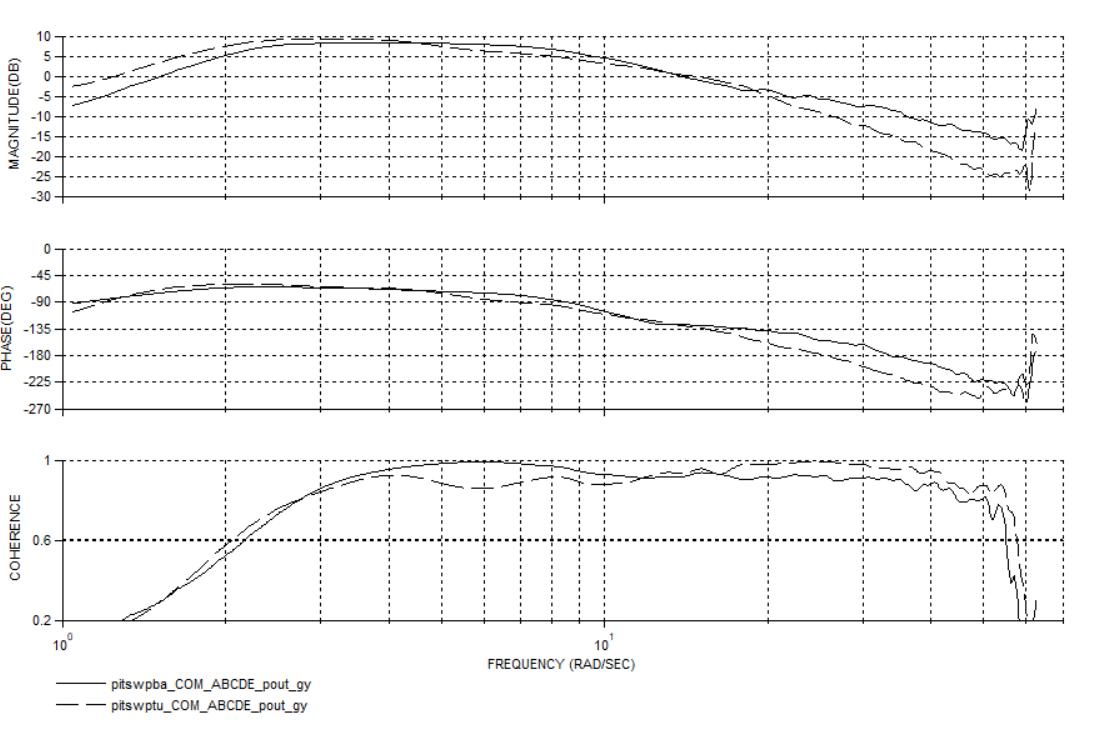
Recently had the chance to do this on a real helicopter that weighed 150 kg. Initially had the user conduct a system ID flight for the pitch and roll axes with rate P and rate D gains set to zero. The frequency responses that resulted from the initial system ID were not as good in the higher frequencies and I don’t know why. These plot below shows the bare airframe frequency response for the pitch axis. So this would be Pout to Gy. You can see the difference in the response between the initial one (solid line) and then the one determined from the tuned System ID flight (dashed line). THere is quite a discrepancy above 20 rad/s.
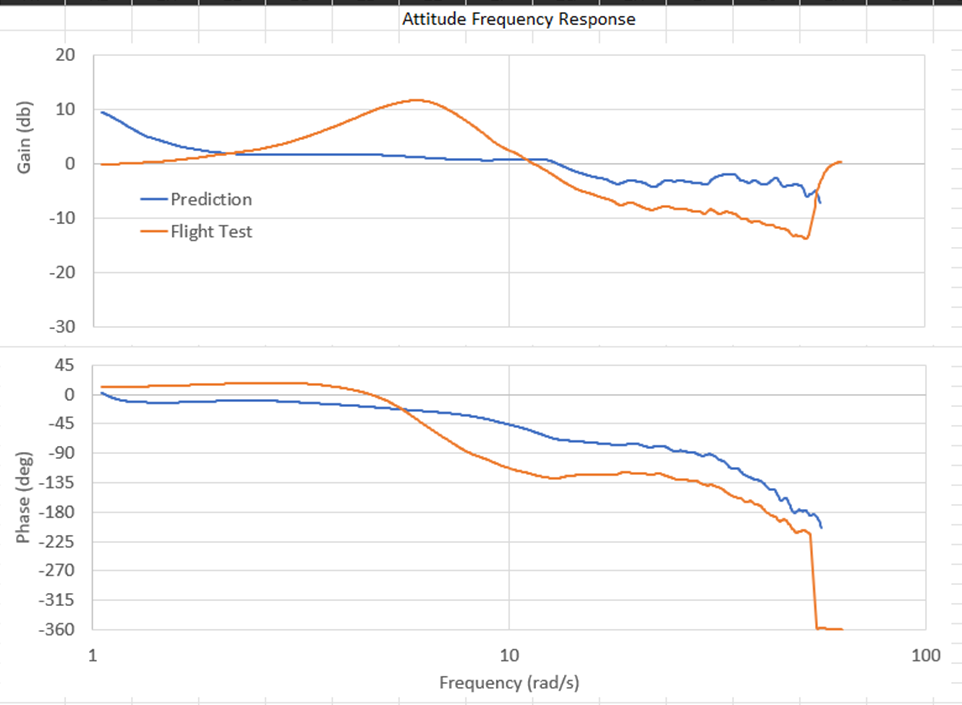
In spite of this, the pitch and roll axes were tuned using the initial frequency response. I was able to determine the max allowable rate P and Rate D gains and used these as guideline to conduct my analytical tuning. Here is the pitch axis tune. The flight test response in this case was the untuned response and then the prediction was the analytically tuned response.
The prediction below 2 rad/s is unreliable. the coherence for the bare airframe response was unacceptable. You can see the untuned response has a pretty high peak around 8 rad/s showing a lightly damped mode which would result in overshoots.
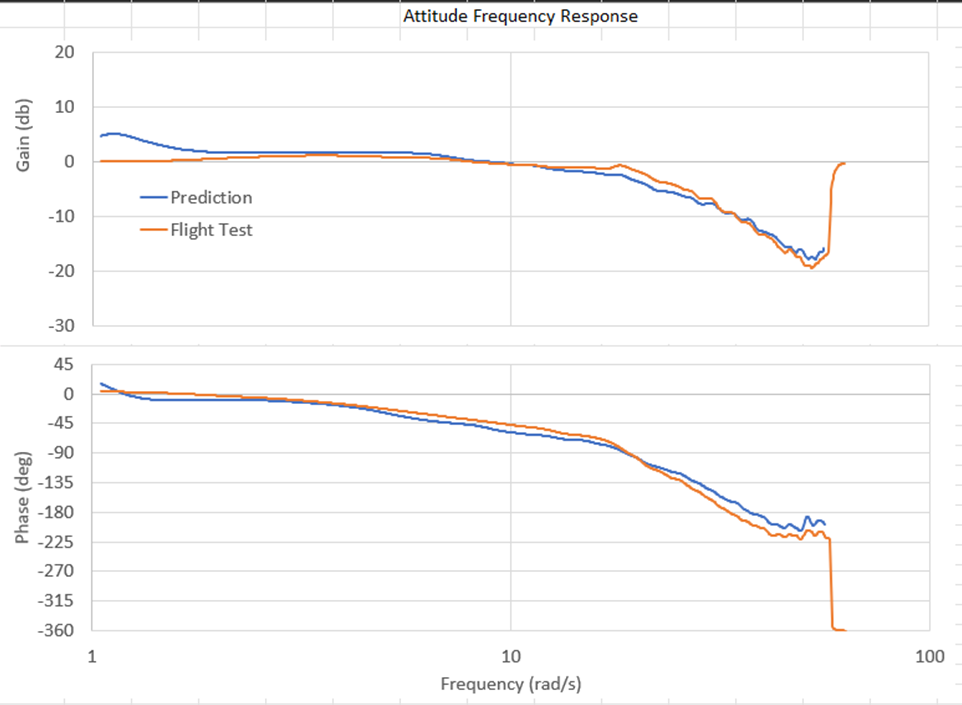
The next plot shows the predicted and analytical tune for the system ID data conducted with the tuned gains. Again the predicted values are based on the bare airframe response determined from the system ID with the tuned gains.
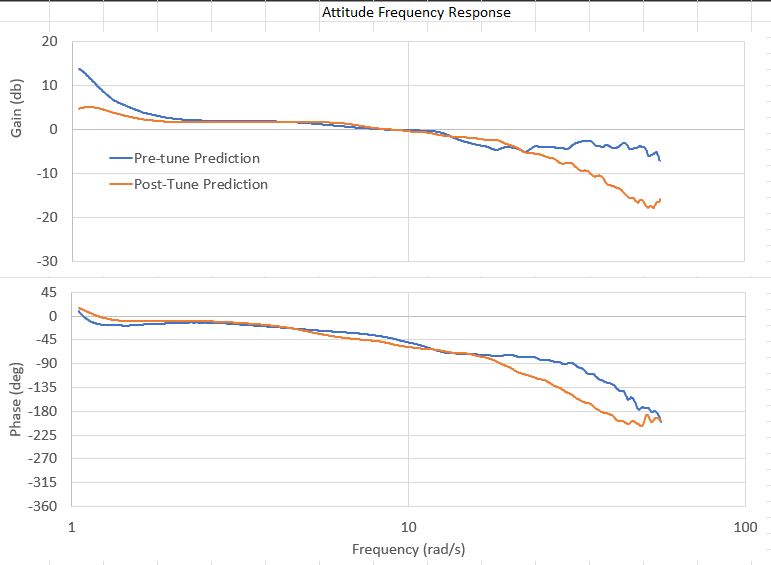
The plot below shows a comparison of the prediction conducted with the pre-tuned bare airframe response with the post-tuned bare airframe response. You can see how the responses above 20 rad/s do not agree. So although there was a pretty big discrepancy, the aircraft was still able to be successfully tuned.
@bnsgeyer, the lightly damped mode that you see around 8 Hz: how can you discern if this is a genuine “control mode” or a structural vibration mode? Do you rely on the coherence to inform this? I. E. If you have a poor coherence at a peak then the output doesn’t correlate with the input and hence could be a structural vibration mode not a control mode?
The reason I ask is because I could totally believe that a 150 kg airframe had a resonance at 8 hz.
Hi Matt (@IAMMATT ),
The graphs are all plotted with frequency in rad/s on the x axis. So the mode is a little over 1 hz. I know that I confuse a lot of folks by using rad/s instead of hz.
Good question! You could rely on coherence for the reason you stated. Controls can couple with any structural mode if the gains are set that the closed loop natural frequency matches the structural natural frequency. In thinking about this more, this technique probably wouldn’t catch something like that unless it shows in the bare airframe response. I think this technique would work well on multirotors because they typically are uncoupled in pitch and roll. I could see that this technique might be less accurate with heli’s because they are highly coupled. Many times the pitch axis will interact with the roll axis and you can see it in the roll response.
So I guess to answer your question, most of the time you won’t see structural resonance in these plots unless the controls are driving it. And truthfully, that is when it really matters. Otherwise it is noise from the controls standpoint.