Hi all,
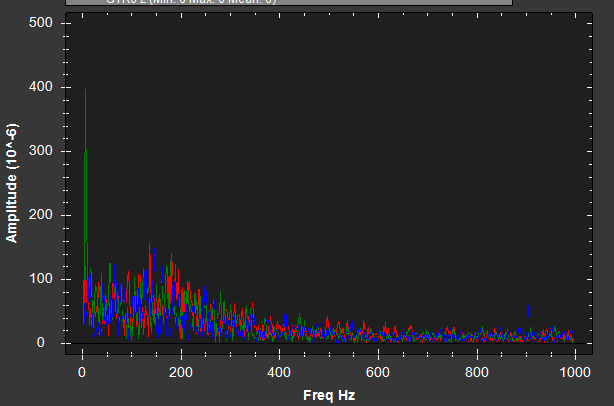
im trying to set up a dynamic notch filter and just following the wiki. However after performing a flight to gather pre filtering data my gyro noise fft graph looks like this. I’m using a 10 inch frame and it says the peak is likely to be around 100Hz
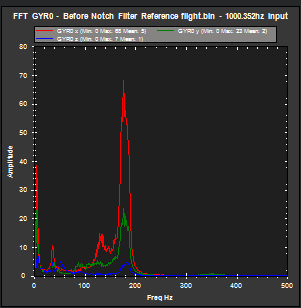
this is the screen shot from the wiki
where the lines very much less and have one clear peak
does my graph indicate some underlying problem, or how can I determine my notch centre frequency from my graph
In the first graph the scale is 10e-6 - so there is not much noise at all, which is good. I suspect you are doing a post filter sample which means that the noise is already attenuated by your gyro filter.
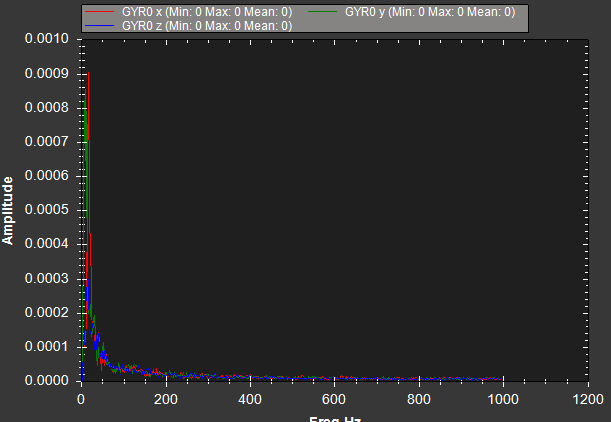
yes the second graph is post filter and the first is before filtering.Just to clarify this is the type of result I want to see and I shouldn’t need to change the filter any more?
oh damn really. maybe I made a mistake. but as u can see I definitely reduced the noise further in the second graph.in the first test I had [INS_LOG_BAT_OPT] = 0 then in the second test to 2. Could it be my flight test. Im keeping it relatively low to the ground and just moving it around left to right forward and back for 40 seconds ish. Should I be doing something to get a better test.
So could i be doing the flight tests wrong? is it even possible to get noise that low, I see on the wiki that post filtering they are getting 0-10 which is a lot more than 0.0001