I’ve been messing around with graphing in MAVExplorer and trying to follow along with some of the discussions here on different tuning issues. I’ve just noticed that when I use the FFT tool in MAVExplorer the gyro graphs don’t seem to display the same data as the FFT graphs in MP.
These two graphs are from the same log file but the amplitudes are different, and the peaks are on different axis.
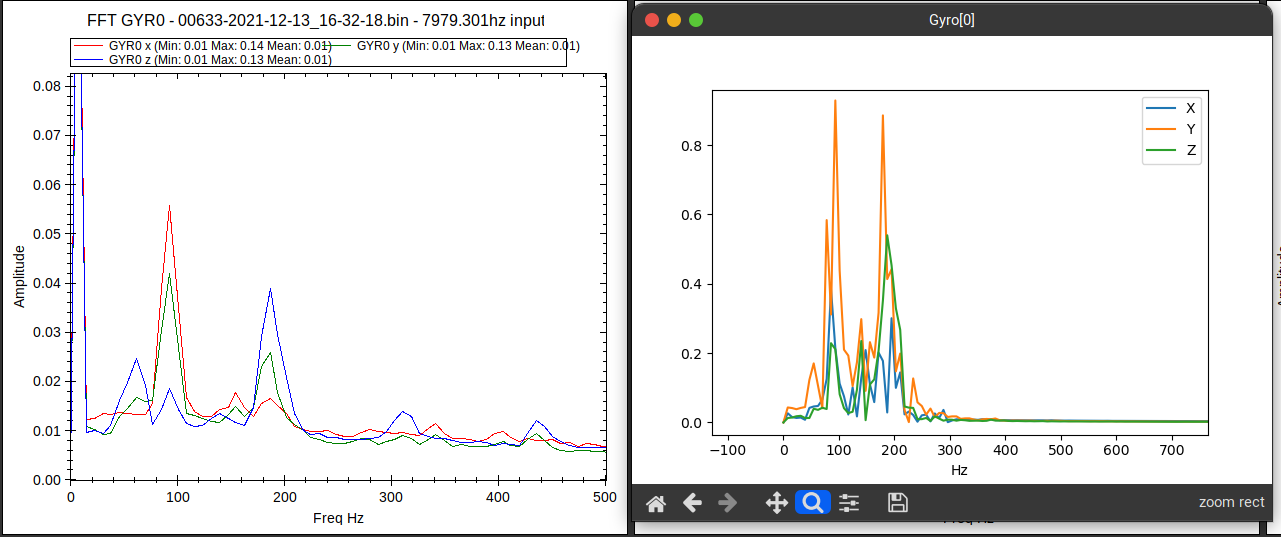
What am I missing?