OVERVIEW
Hello everyone we are currently facing watchdog reset problem on one of our particular kind of custom board and before we move on to our analysis and findings let me give a brief overview of everything yet so far. so we started developing our own custom fc based on STM32f405 we started by looking at the schematic of omnibusf4pro board and replacing the sensors(details later in the discussion) as according to what we think are good for our use case we started with 2 layer fc board which is quite good in overall ardupilot related tasks but it’s somewhat noisier in terms of em interference so we moved on to making 4 layer board and that’s when the issue started to arise everything is so random that we can’t able to conclude what’s going wrong in very particular and That’s why we need help with the issue. some of our drones even restarted in the mid flights ultimately resulting in crash, these are so random that some of the drones based on the same board fly perfectly while some we doubt can cause some issues later(we concluded this by looking at the logs which also we share in the discussion later).
BUILD
Our first version of the board based on stm32f405 and basically somewhat similar to
omnibusf4pro just few sensor replaced and it’s a 2 layer board with these sensors listed below
IMU- Icm2060
Baro- MS5611
SD CARD MODULE
Schematic of ether
FC_ether.pdf (212.9 KB)
hwdef for ether
hwdef_ether.txt (2.2 KB)
we tested this boards a lot and never had any problem with it’s functioning whatsoever only
problem is that it’s a little noisier and it’s messing with gps signal and magnetometer so we discontinued further development of this board and move on to the next version.
Second version of our board is a four layer board with lots of changes major change is that now it’s a four layer board and one sensor got changed Baro changed to DSP310.
Schematic of jynx
FC_jynx.pdf (199.8 KB)
hwdef for jynx
hwdef_jynx.txt (2.3 KB)
now in these boards we are getting internal error 0x800 i.e. watchdog reset and that also on few boards not all of these and hence we started debugging from our own end.
First we started with sensors and peripherals we thought may be causing some issues. We
removed almost everything except the one necessary sensor that is IMU and tried running the board and then also no luck still getting the issue.
OBSERVATIONS AND LOGS
We have tried different arducopter firmware versions like 4.0.4, 4.0.7 and 4.1.0-dev and beta versions as well, this issue occurring with all the firmware versions on our current custom build FC, so this issue is definitely does not seem related to any firmware issue and we also confirmed that by running above different versions on original omnibusf4pro. On the
original board there is no such issue.
From firmware end, we tried disabling other features and hardware components but this issue is still occurring with a minimalist build where only IMU is enabled and just OTG, one UART and some PWM pins has been set in hwdef.dat file.
Watchdog messages on Mission Planner is also not consistent, they keep varying, they keep
recurring in different threads, sometimes they also vary cause of enabling/disabling some
features and hardware configurations in APM_config.h and hwdef.dat.
We have been through this documentation Independent Watchdog — Copter documentation, we have parsed them using watchdog decoder script, Tools/scripts/decode_watchdog.py, we get that it is some hard fault error but it is not helping much in finding the source of the problem, since there are few different watchdog messages, it’s getting more complex in catching the source of this hard fault error.
That being said, not all the custom build FCs in this set triggering the watchdog, we managed to fly some of them without any reset in air, but we know that we are taking risk, and those
quadcopters which we are able to fly showing some anomalies in the logs, specially PM logs,
attached one such log below where PM.NLON, PM.MAXT and PM.LOAD suddenly rises during flight but all of them able to complete the flight safely so far, these PM log anomalies also does not occur in every repeated flights and these kind of PM logs never been seen with original omnibusf4pro FC. This kind of logs can also be seen in similar custom build FCs which are flying well so far but we never know if they are safe to fly or they can trigger watchdog midflight anytime.
NOTE: log for the watchdog reset has not been attached, we can provide if any one like to checkout, these logs showing some runtime anomalies which we doubt might still cause watchdog reset
in this log PM.NLON, PM.MAXT, PM.LOAD suddenly rises in mid-flight
in this log PM.NLON, PM.MAXT, PM.LOAD always remained high almost from the start, in both of the logs there is also another pattern that there is some direct relationship between PM.NLON troughs and PM.ExUS crests.
We are now focused to solve this issue, that’s why we have involved with low level debugging
like mentioned here,
DEBUGGING FROM FIRMWARE
Then we started some work from the firmware side debugging. We have successfully set up the environment and tools to debug Ardupilot firmware in windows using GDB/Openocd, Cygwin and Eclipse IDE.
On debugging the firmware using gdb and openocd commands VIA CLI, we get across some doubts which are listed below:
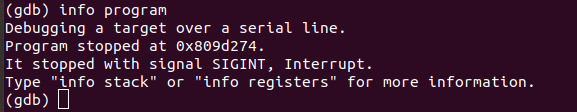
[1] As you can see in comparison between mission planner and gdb and openocd output.
In mission planner it is showing that it is resetting the watchdog in thread Rcout, but when seeing all threads in gdb by info threads command it shows that it is inside some other threads and also not showing any sign of watchdog reset.Why is it so? Why are different threads being shown in mission planner and gdb? Is there some fault in gdb commands to analyse the threads or is there some concept clarity related to Chibios threads which we are lacking to not understand this behaviour.
Mission Planner and GDB comparisons:
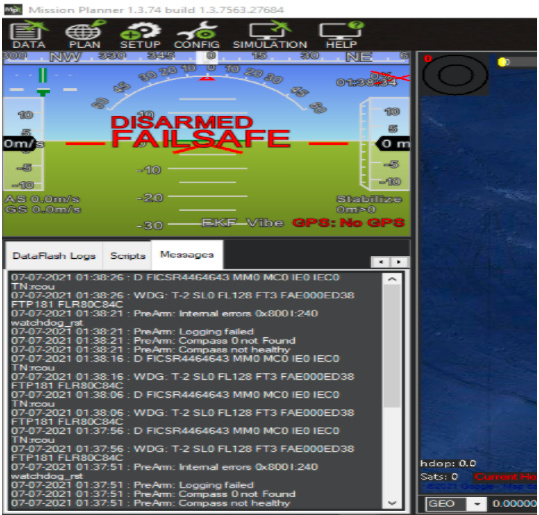

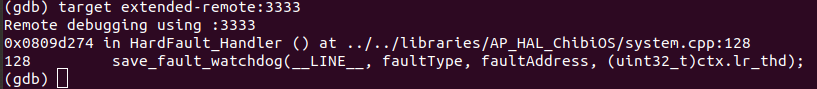
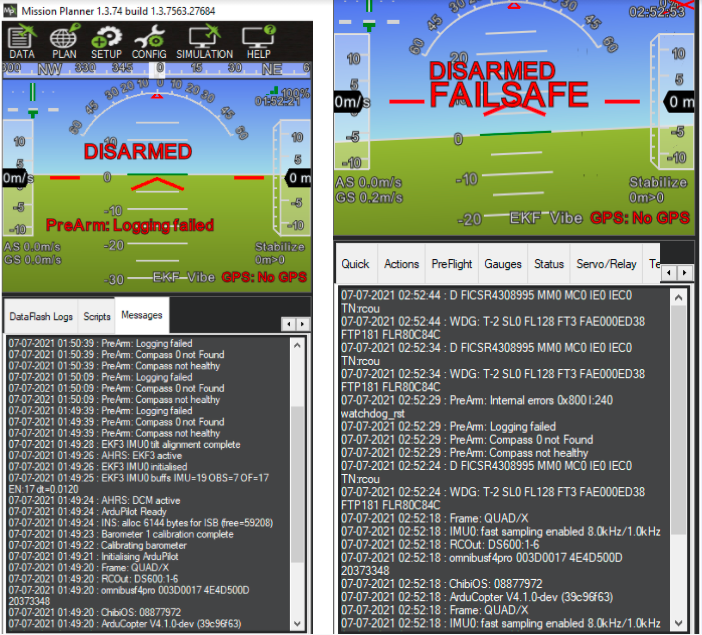
[2] Sometimes the same firmware shows different output on the mission planner, sometimes no error message is shown in the message window of the mission planner and sometimes different error messages are shown in the message window of the mission planner. On the contrary, at GDB and Openocd output, it doesn’t show the thread’s location sometimes, does it indicate any fault ?
Different Outputs at Mission Planner:
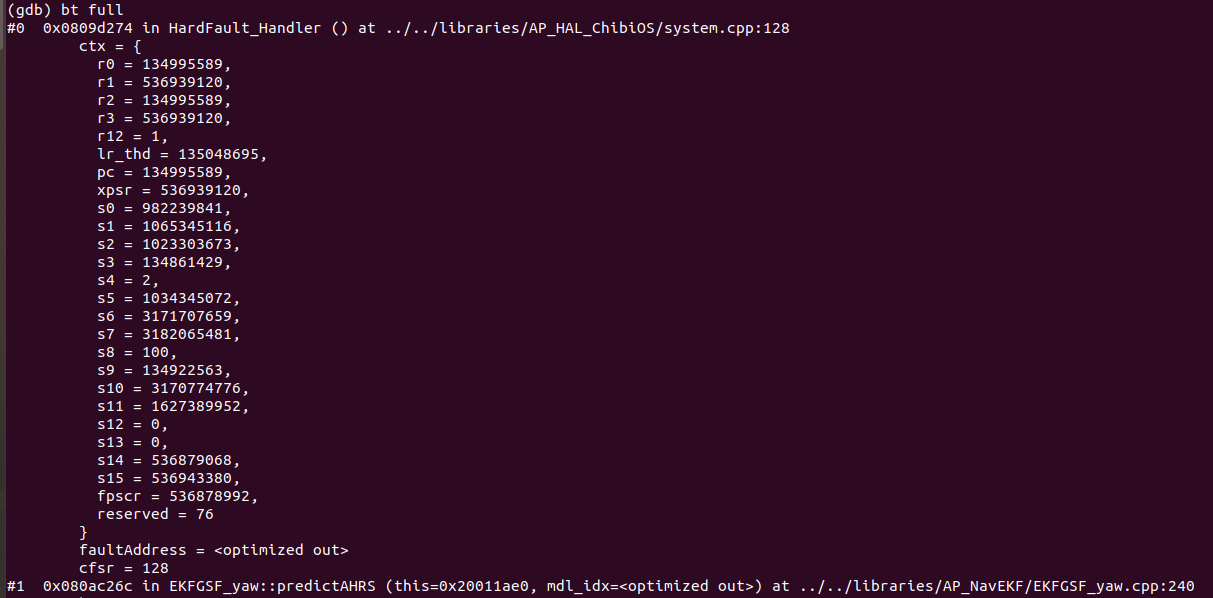
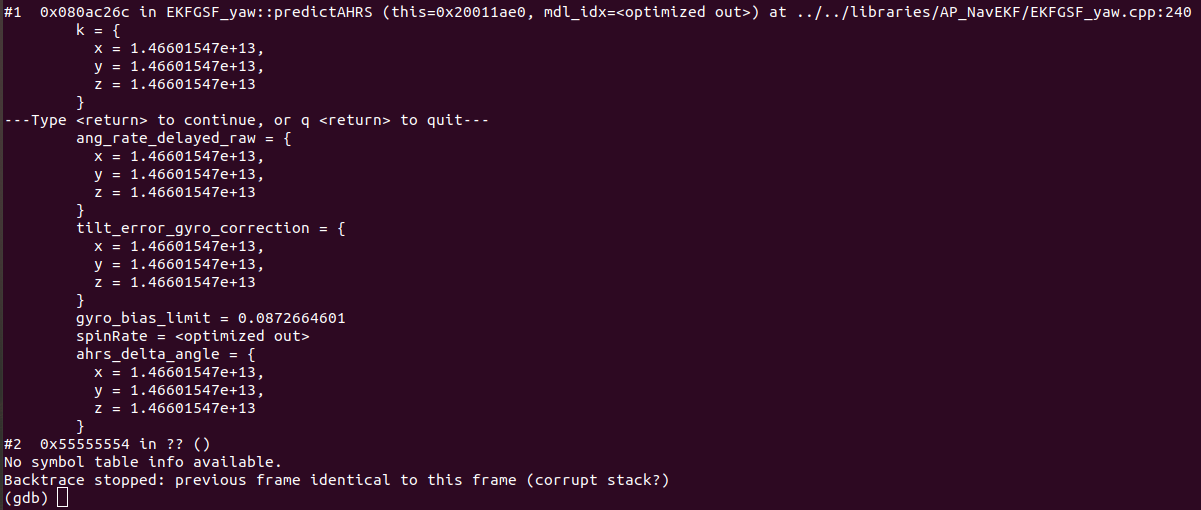
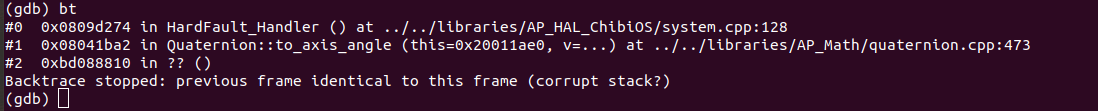
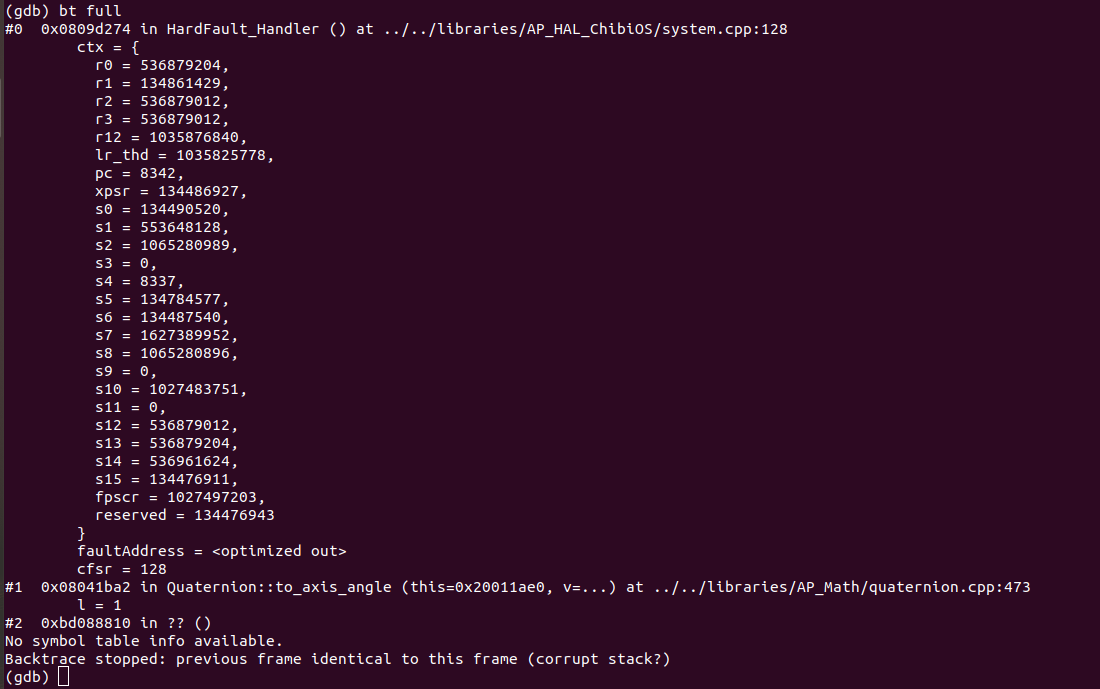
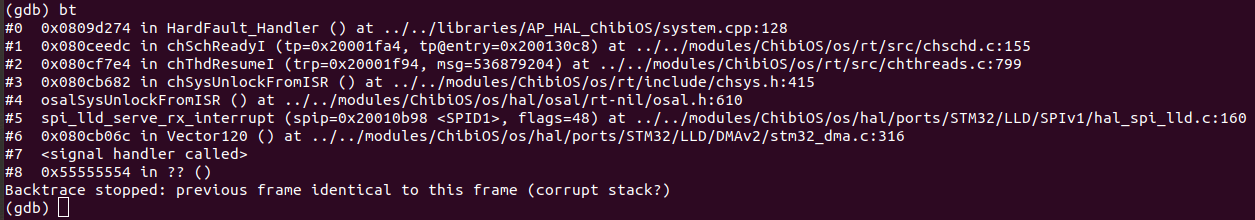
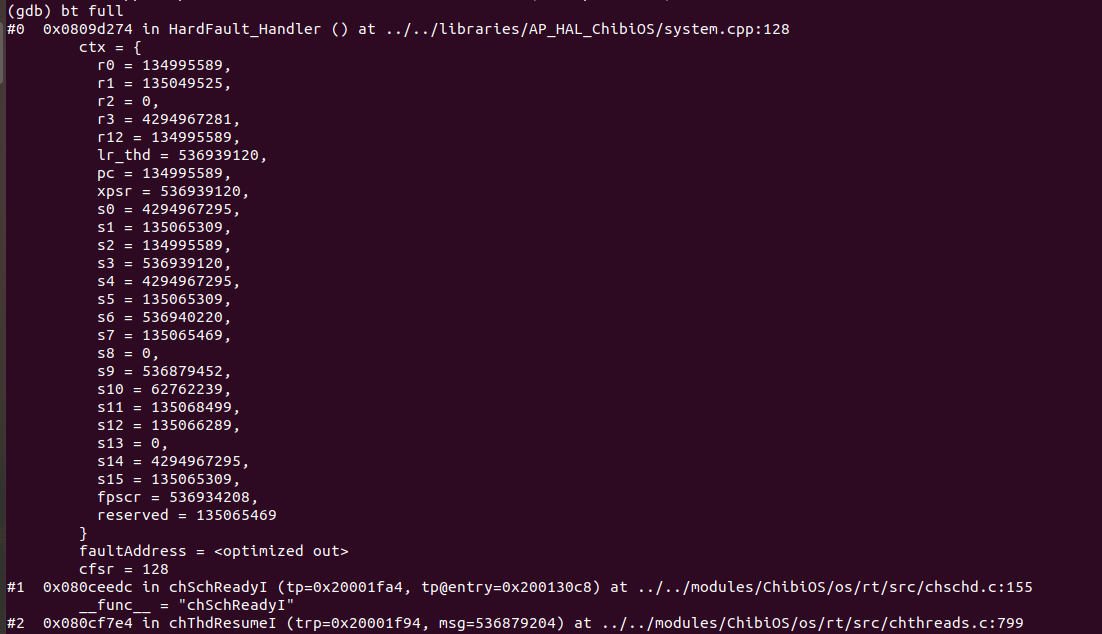
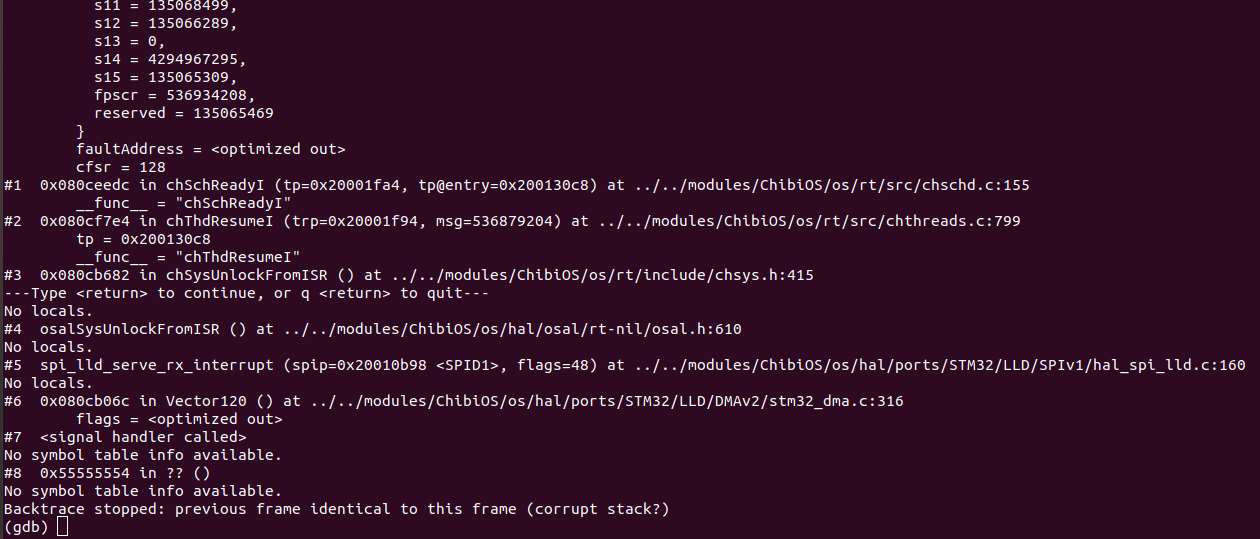
Different Output at GDB:
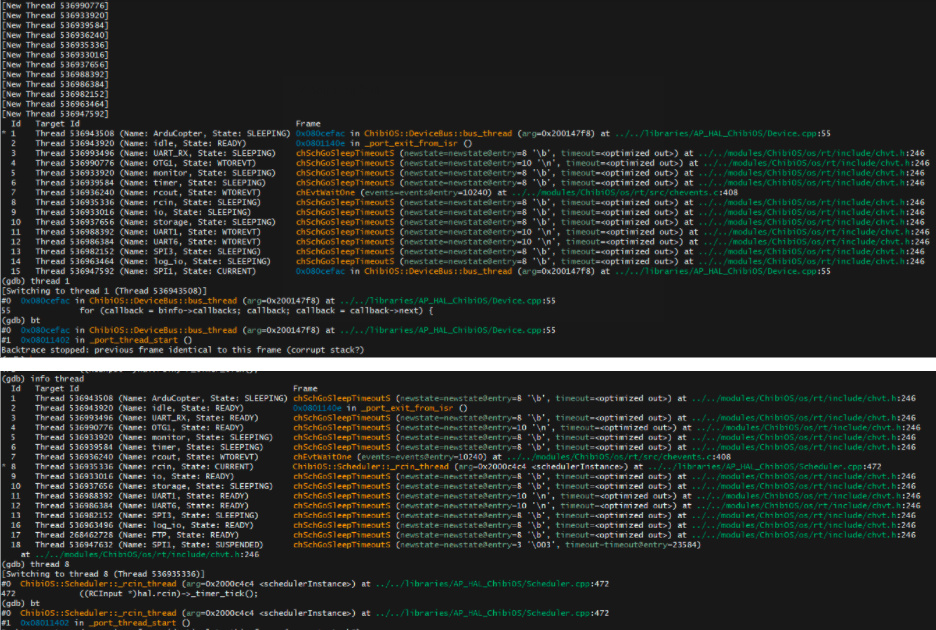
[3] After successful connection at gdb and openocd and then doing info threads so as to see my threads running, it lists the number of threads running as shown in image. I just want to clarify the concept here. The threads which are shown are the ones which are/will run parallelly/simultaneously ? And alongside them it shows the file location of the threads in most of the threads but alongside some threads it doesn’t show any file location or line number. What does it mean? Where is that thread in my firmware? Or is it some indication of error/fault?

So to conclude, we need help or insights from firmware end on what things should we focus on? How should we approach ahead to debug this problem ? We just looking to find the source of this problem, we are planning and working to integrate all the components, ESCs, sensors on a single PCB board, so going ahead if we come across this problem again then we might be better prepared to deal with it if we can come to some conclusion with our current problem.