Apart from the obvious, (screen shots side by side etc) is there a smart way to compare two logs, before and after, to see if there is an improvement?
My new copter was borderline with vibration, with increasing clip3 (perhaps 300 in 5 minutes hover).
Ive now installed TPU ‘springs’ on the cube. The change may be subtle but just wanted advice if there was a better way to compare.
Thanks


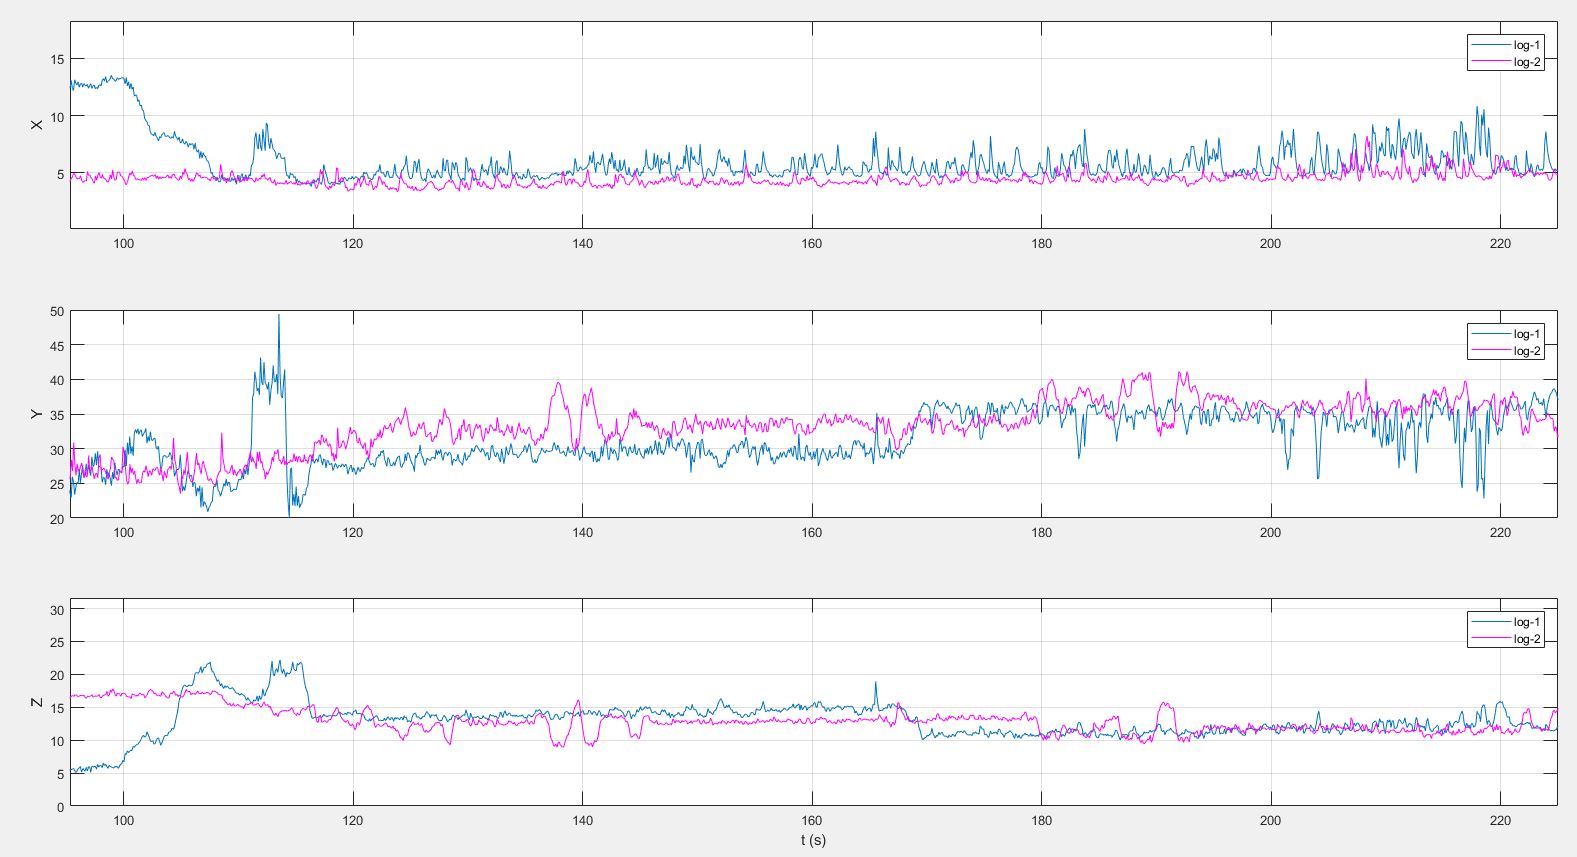
Ive done that already. Its what I called ‘the obvious’ way, putting screen shots side by side. Your scales don’t line up which dosent help if the differences are subtle.
I was asking if there was a better way to compare 2 logs.