Hello, here is the flashlogs of the flight that I tried to perform Autotune. Can someone help me analyze my autotune results before going for a full AUTO flight. The change in P gain seems strange to me, it starts increasing and decreasing all the way. I did not feel comfortable. How can I understand or test my autotune results in a safe way? Before, I already got my plane stalled when doing RTL after autotune.
Thanks in advance.
1 Like
- your plane have little rear CG
with my experience plane with rear CG is more susceptible to stall. - not enough twitches for pitch
- also you move sticks too high
- I think your P too low for this plane.
- Can you explain this?
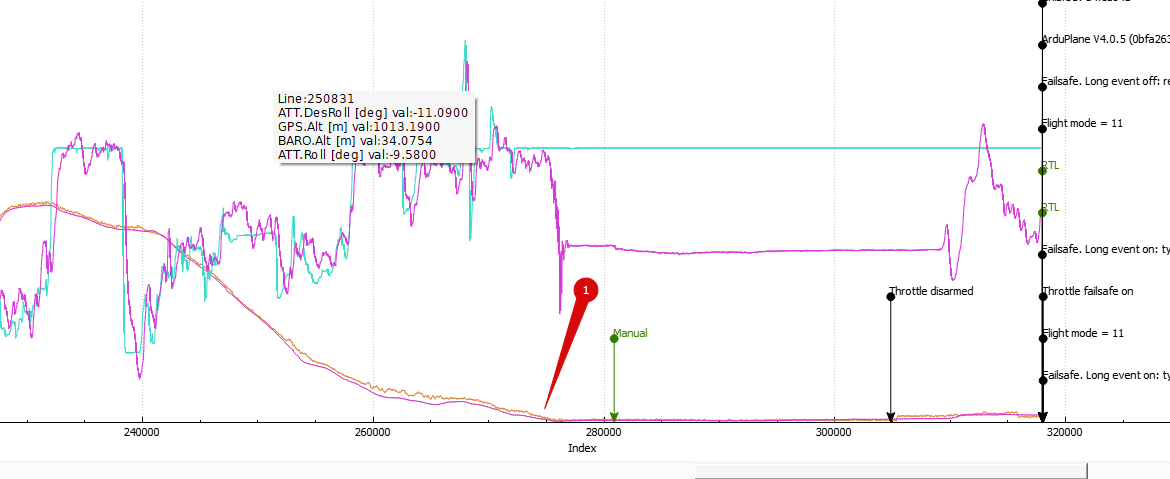
i see zero altitude before you switch to manual
First of all, thank you for you attention. But I want to know what are your reasons to result in like that.
1- How did you come up with that result from that graph?
2- Yup. Need at least 20 stick movements, I did not know that when I was doing autotune.
3- AFAIK, I need to push the stick hard that makes the rates at least %80. There is no such information on upper limit?
4- How did you find out that?
5- So what? Pilot might have changed to mode right after landed? What is wrong? It landed with FBWA.
sorry, forgot to answer
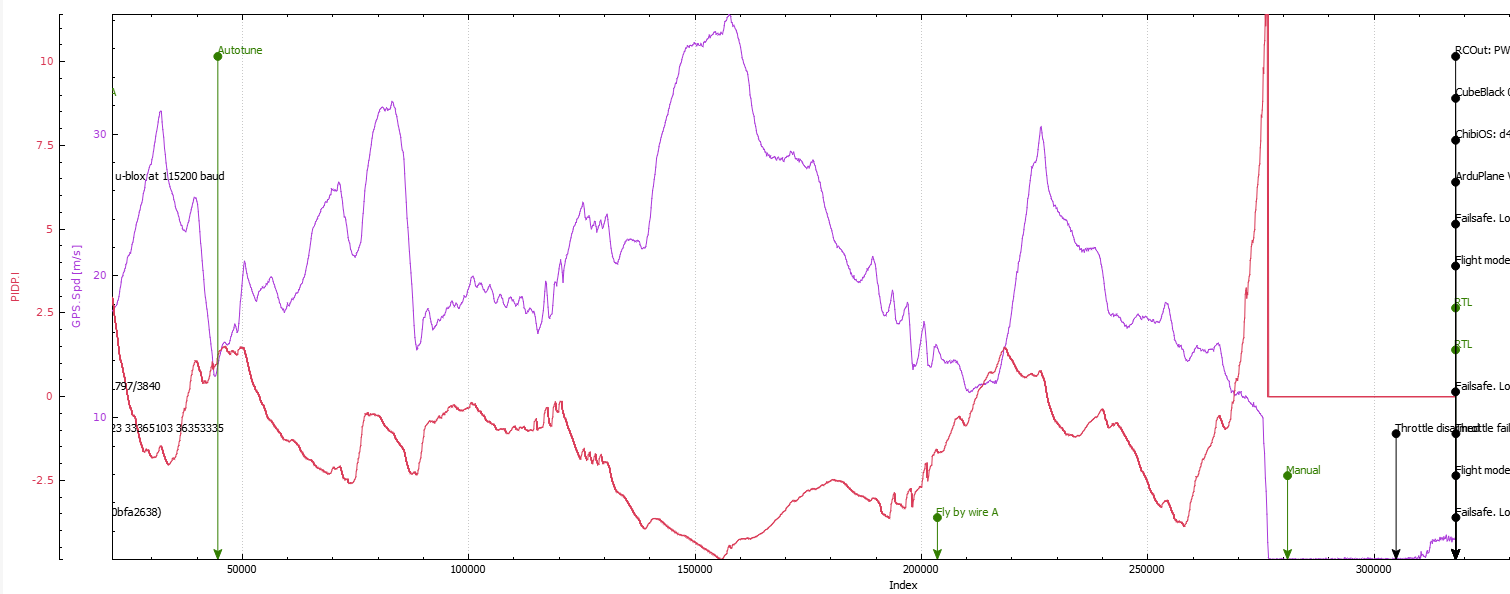
- PIDP.I below zero all time. This means rear CG. You can find info about this in documentation.
- You should only do one of either roll or pitch at a time, and you should move the stick rapidly to the maximum deflection.
https://ardupilot.org/plane/docs/automatic-tuning-with-autotune.html
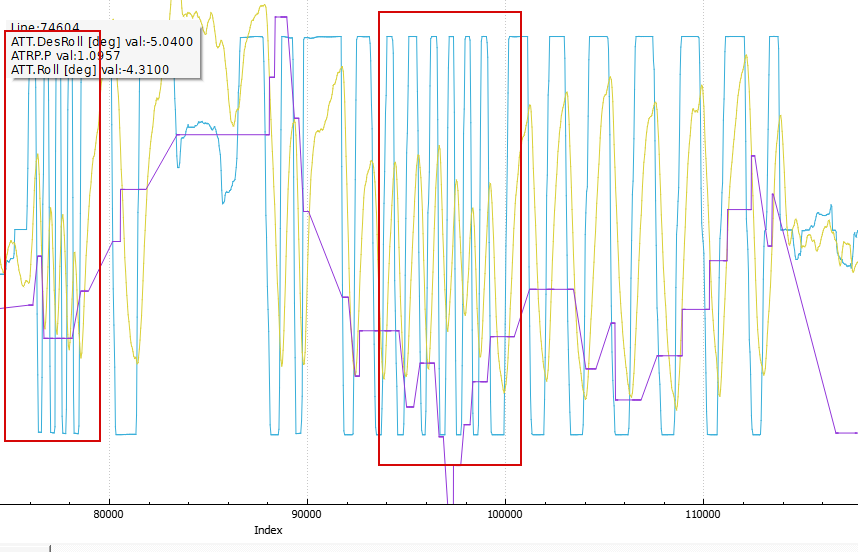
also too you move sticks to high because in left part of graph ATRP.P not changing while you move stick. This means autotune not use this twitches to tune plane
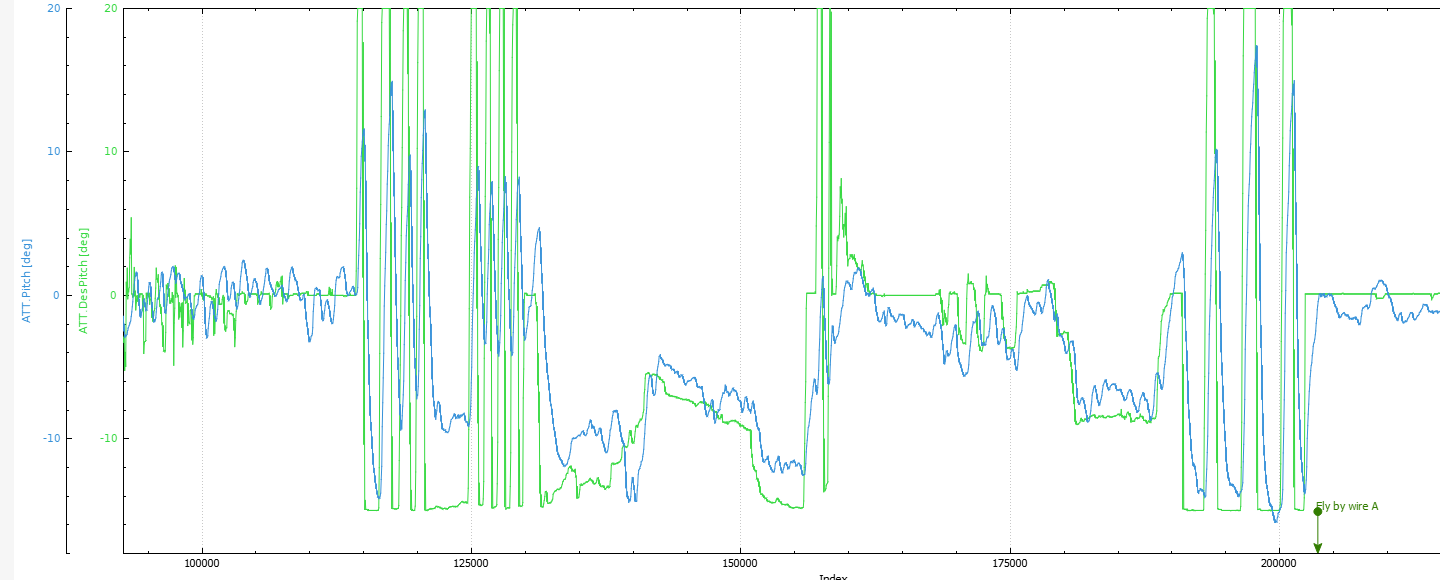
4.ATT.Pitch far away from ATT.DesPitch. It is my hypothesis, I not sure with it. Also may be too low “I” - I not found stall in graph. Only landing, than manual mode, and only then RTL. If i wrong show this moment on graph
@Alexey_Degterev can you please let me know what is the software tool used to chart logs like the screenshots you have posted here?
Thanks a lot in advance.
Thank you for your attention. I will work on these
That is APM Planner’s log graph