With the very kind help of @Allister I’ve learned about built in functions in Mission Planner and user defined functions in MavExplorer.
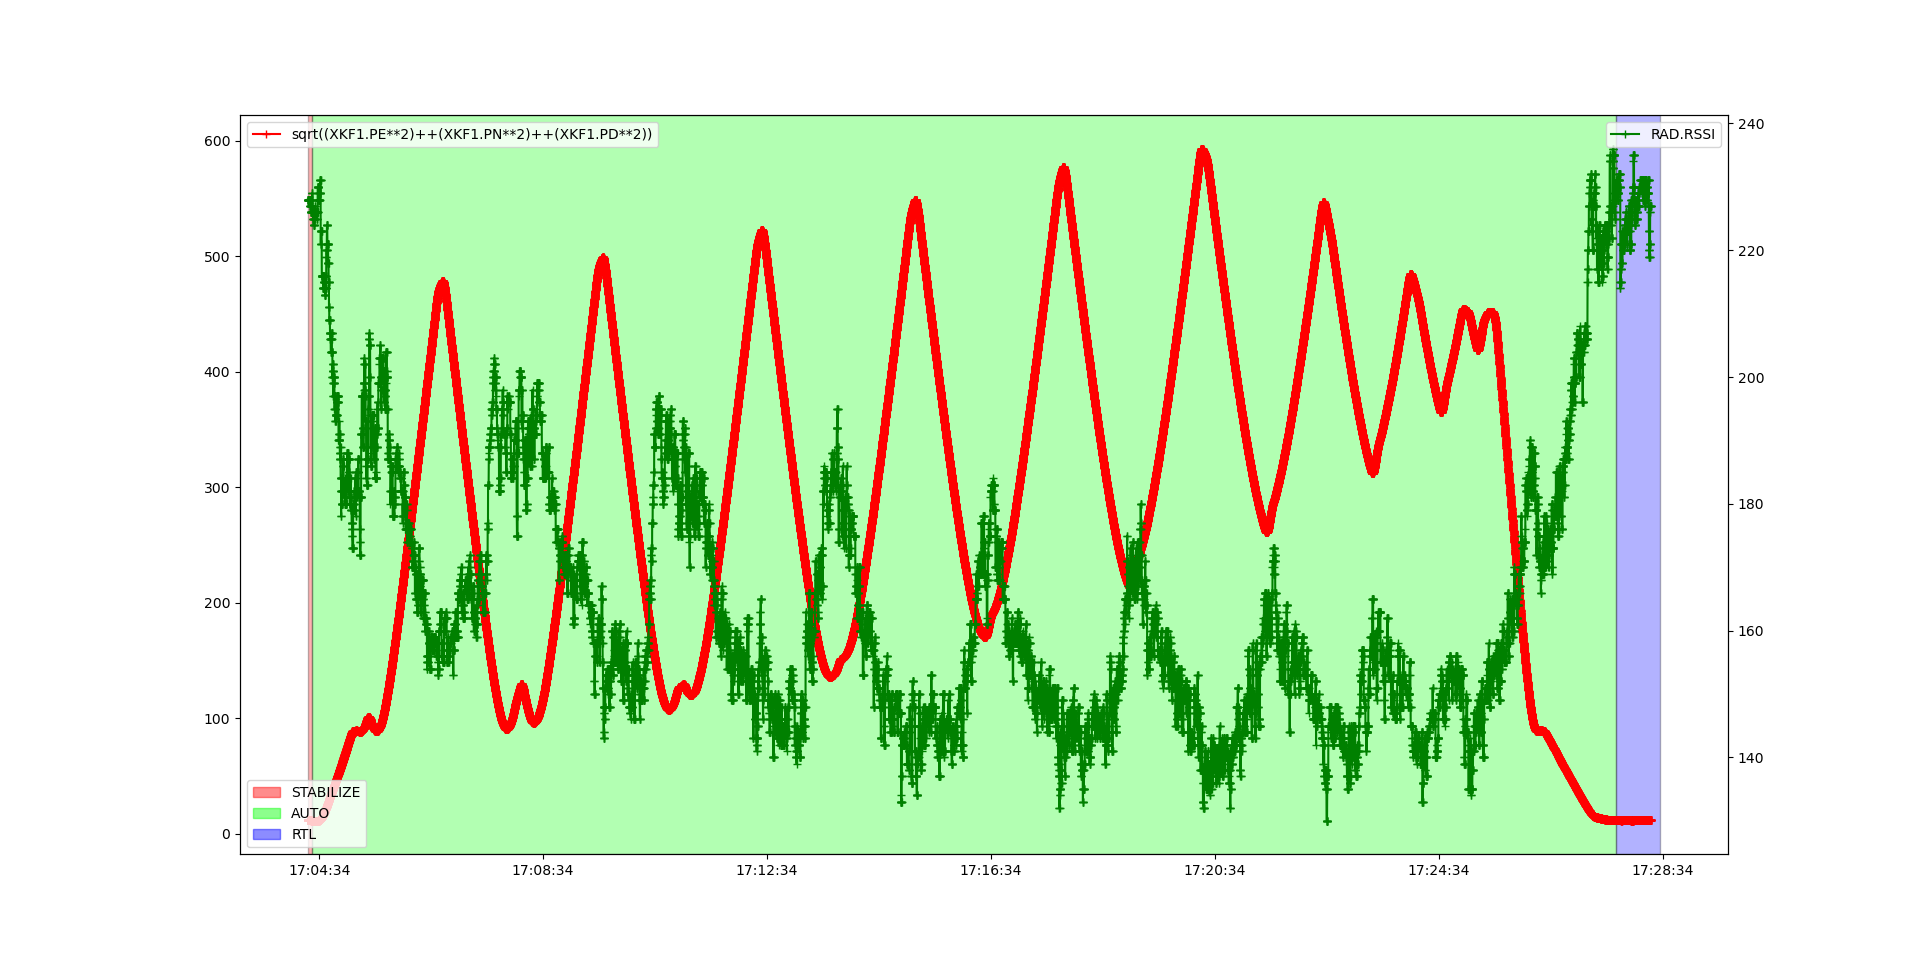
My goal was to plot distance to origin against RSSI - to examine the relationship.
The expectation is that signal strength goes down as distance increases. Being able to graph this relationship for different antenna helps in comparing the effectiveness of different antenna.
The built in function for distance to origin in Mission Planner doesn’t include EKF1.PD - the vertical element of distance. For radio signal strength, distance in three dimensions is necessary.
I was able to plot this comparison in MavExplorer using a user defined function - but the result wasn’t what I expected.
I expected RSSI to reduce as distance increased. But the reverse is shown in the graph.
I’m unschooled in radio engineering, but if the RSSI reported is a negative dB - then my plot makes sense - as “smaller” would mean “stronger signal.”
Can someone please clarify how ArduPilot reports RSSI?
As info - this RSSI comes from a HereLink V1.1 connection.
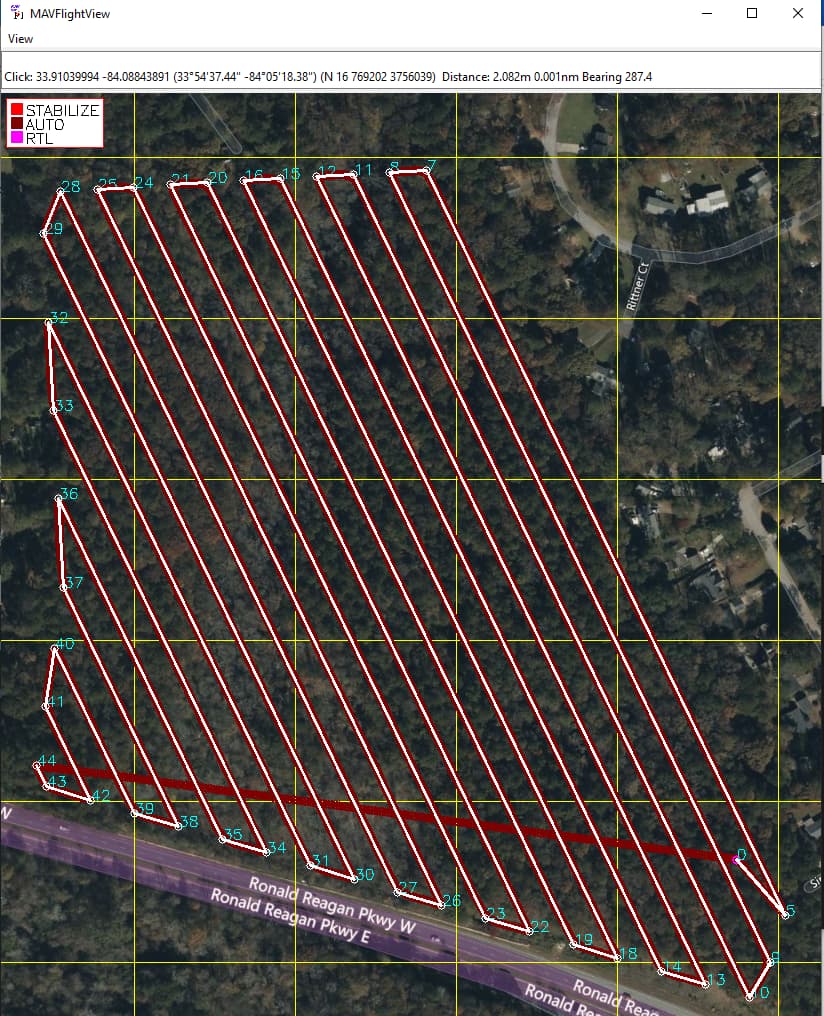
I went back and found a representative BIN file from a photo survey mission using a RFD900x SiK radio for telemetry. Here the relationship between distance and RSSI is what I would expect.
Received signal strength is just an indicator and it depends on the hardware capabilities.
It can only be evaluated for the same hardware setup, different environmental conditions.
For example some radio modules can handle -80dB but others are unable to process this kind of weak signal because of the preamp capabilities of the radio module so it’s impossible to evaluate with just using this indicator.
Even when you use a different antenna for the same hardware, the RSSI will be totally different.
RSSI based localization is still in focus of acedemic researches.
Here is the source code how the autopilot handles with the RSSI data if provided by the radio modules.
I had previously read the article you cited - and many more over the years.
Some of the articles I’ve read give the impression that there is a “defined” meaning of RSSI. And some suggest that RSSI is what ever the radio wants it to be.
It appears that ArduPilot simply takes the values from the radio and saves it in the log - there’s no “normalization” of the data.
I’ve asked CubePilot to verify this - but it appears that the HereLink reports the absolute value of the dB signal strength. So instead of RSSI of 0 to about -130, it reports 0 to 130. Values closer to 0 indicate greater signal strength.
The RSSI recorded from my RFD900x SiK radio example shows RSSI values from about 140 to 240 - where higher values mean stronger signal. This is obviously very different than the values reported from HereLink.
I seem to recall reading that RSSI isn’t a linear representation of signal strength. But perhaps that’s only true for one “brand” of RSSI.
I recall reading some extensive discussion about this in BetaFlight regarding OSD display of RSSI. This and among other reasons is why companies like Team Black Sheep use other signal strength indication such as LQ - Link quality.
I may never have enough expertise to have my hands fully around all this - but now’s a good time to make some effort at it - and I appreciate your input.