Tool to quickliy visualize log data

Tried to find out what application produces graphs like this one:
https://discuss.ardupilot.org/uploads/default/original/2X/e/e57dff4222fd0f840f193891ca8a77faa3271598.png
grafik
Can someone give me a hint or recommendations for similar applications (for Linux)

Thanks, Max

That is APMPlanner2 , great for analysing logs, and like any decent application in this century, it runs on Linux too.

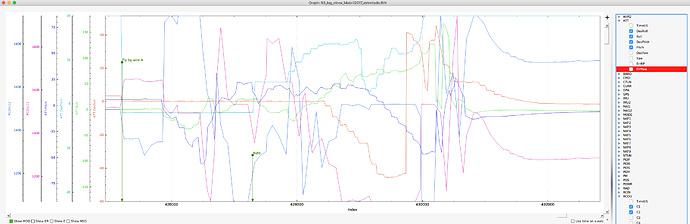
Yes, that’s APM Plannner which has better graph controls than Mission planner IMO.

But I’ve recently started using dronee plotter. Its blindingly fast and pretty similar. Has a few bugs when try to upload multiple logs, but works great for a single log.

https://plot.dron.ee