Hi,
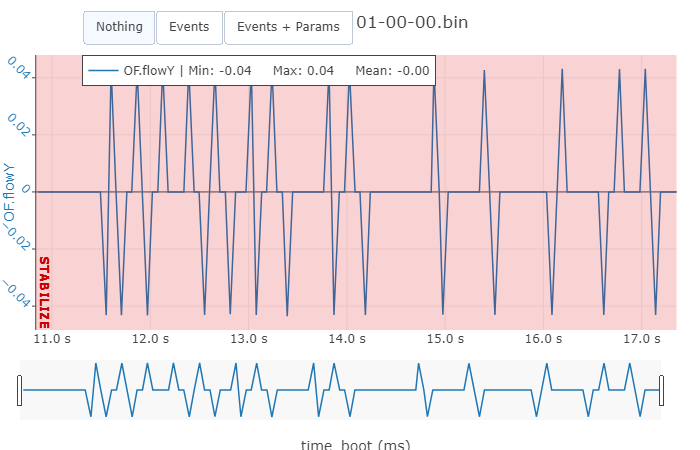
I’m trying to use HereFlow, but when I plot OF.flowY my curve is really strange, why do I have flat spots on my curve ? I’ve tested 2 HereFlow same result.
It’s totaly different with this curve why? I’ve set my HereFlow position with FLOW_POS_
If I plot OF + IMU OF doesn’t follow IMU
9 01-01-1970 01-00-00.bin (152 KB)