While carrying a laptop and ardupilot flight stack through a double door, I tripped and nearly fell on my head. In recovering I pressed some random keystrokes that exposed a window in Mission Planner I had never before seen. It was called Raw Data and included a set of interesting gauges displaying raw data from the flight controller. I was not able to replicate the event, so please respond if you know the proper keystrokes to open this window.
1 Like
Try the tuning checkbox on the main flight data screen (at the bottom of the map).
The chart that appears can also be double clicked. This results in a detachable window where parameters to be live charted can be selected.
I am familiar with the tuning window. What appeared during my fall was a screen that included several gauges and a title “Raw Data.”
Than probably you need to trip and nearly fall on your head to activate, but please remember to do it trough a double door or it won’t work 
3 Likes
I am all bruised up from repeatedly trying to open the Raw Data page with no success! Seriously, I am following this thread in hopes of discovering some new gem in MP.
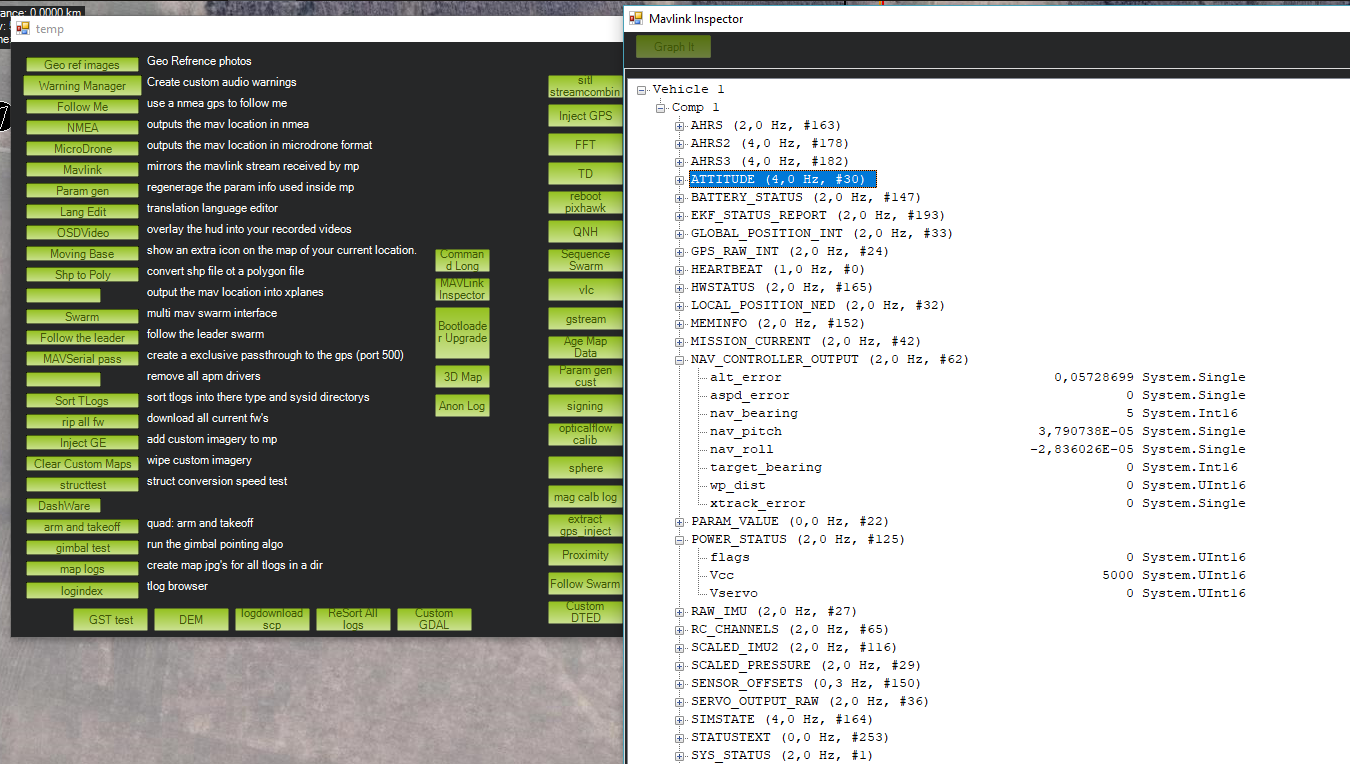
Not the exact screen but definitely on the right track. I tried a bunch of Control+ sequences and discovered other screens. My guess is Michael has a few that none of us have discovered.
Hi Ronald,
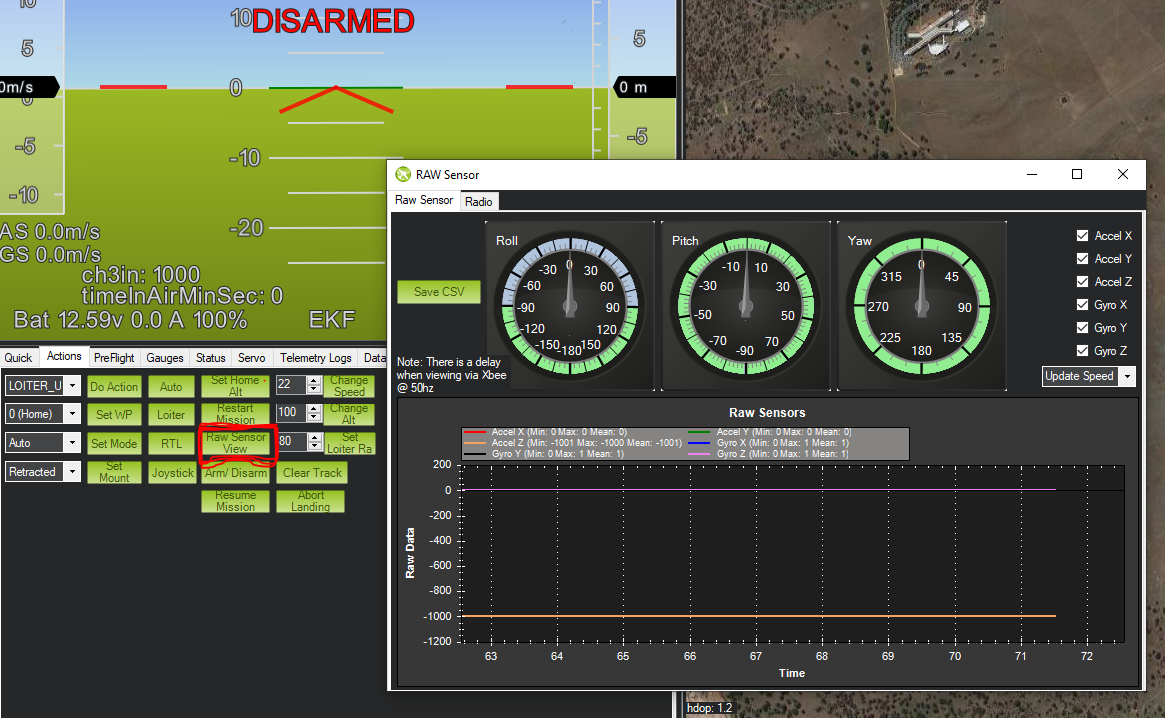
Could you be talking about the “Raw Sensor” window. You can bring it up by clicking on the “Raw Sensor View” button in the Actions tab.
1 Like
Yes! That is the screen. I must have clicked on it with my nose as I fell on the floor. Thanks so much. My staff was starting to think I must have suffered a concussion and dreamt about the screen.
1 Like