Hello to all,
I try to understand the above graphic,
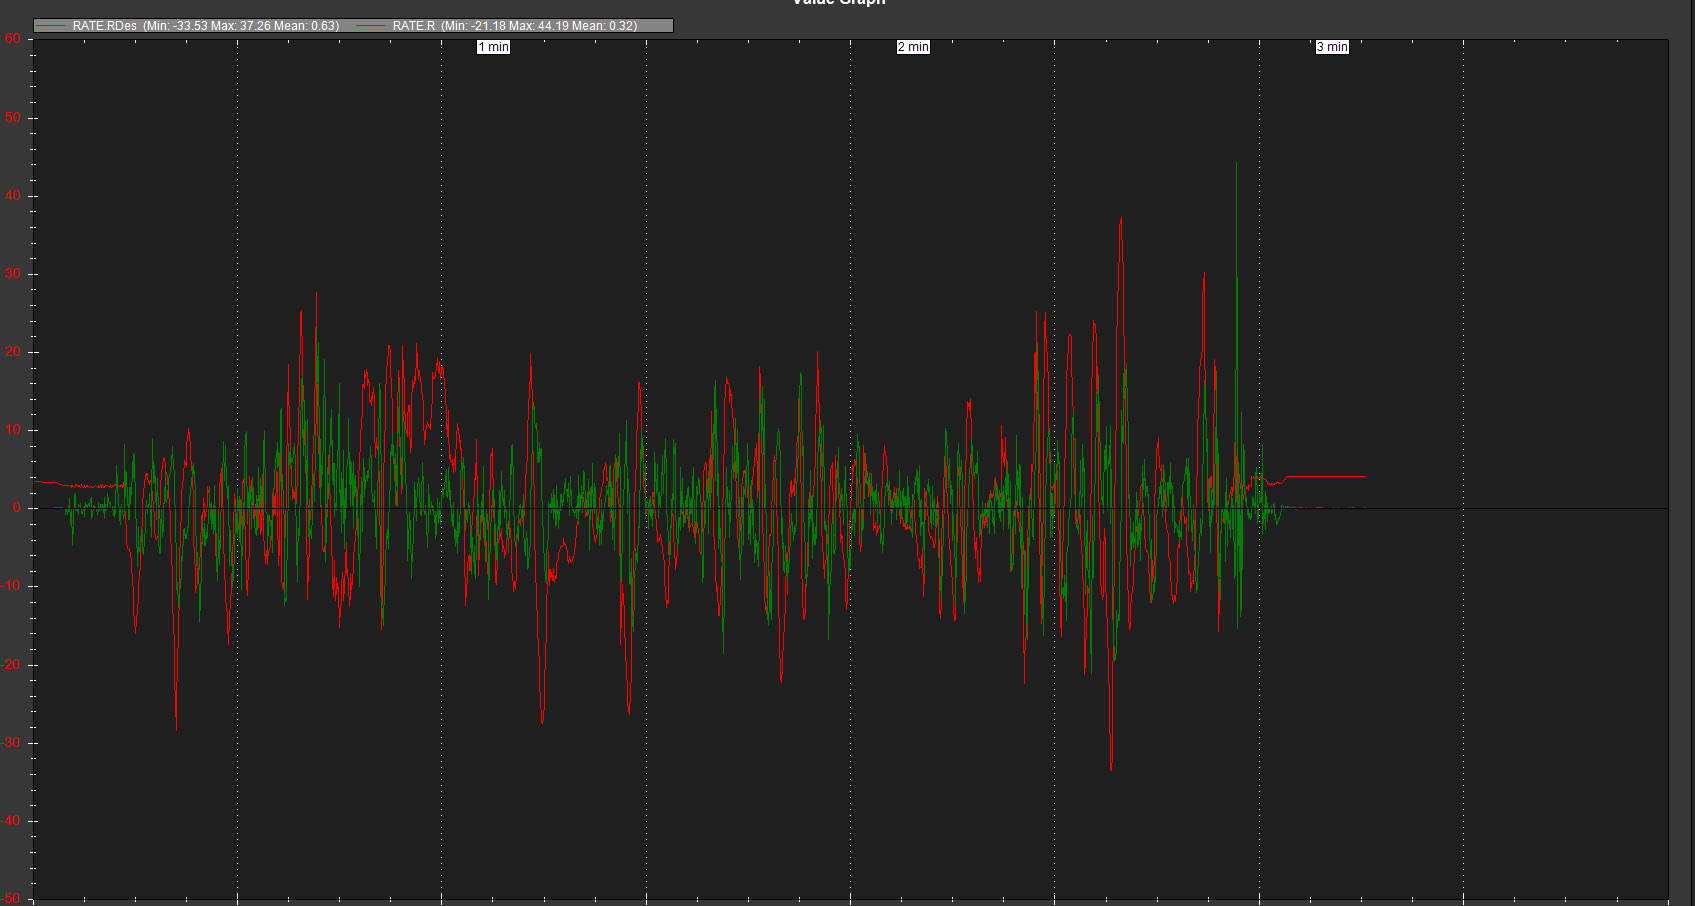
Can someone explain what i must see or tune as an overall approach,
Thank you all for your time.
King regards
Hello to all,
I try to understand the above graphic,
Can someone explain what i must see or tune as an overall approach,
Thank you all for your time.
King regards
Anton, Have you done any autotune?
Absent any other information, the only advice anyone can give is to tune it. Admittedly, that isn’t very informative, but a single chart of incomplete data doesn’t tell enough of a story to be more specific.
The approach to making it better is entirely outlined here:
https://ardupilot.org/copter/docs/flying-arducopter.html