Notch filter testing

I just discovered the IMU notch filter while doing a few test flights with master and I think the results are worth to report here.

A few words about the vehicle: quadcopter, 4x 17" props, 3.7 kg, 6s. The frame is pretty rigid, props are spinning at about 3100 rpm during hover. FC: PixRacer, very carefully insulated from vibration.
.
However, at sharply tuned PIDs, there always was some tendency to run into a self-sustaining D oscillation on roll, depending on actual takeoff weight and weather. Often that happened in the middle of the flight and was gone a few minutes later. When it happened, the reported VIBE level went up from normally 1…4 in hover to 20 and above.

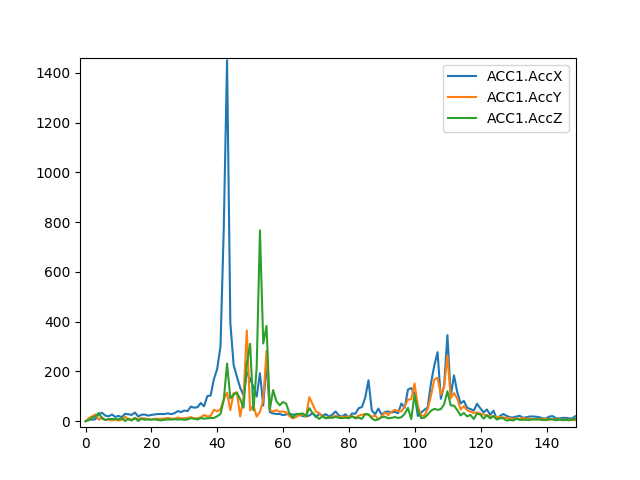
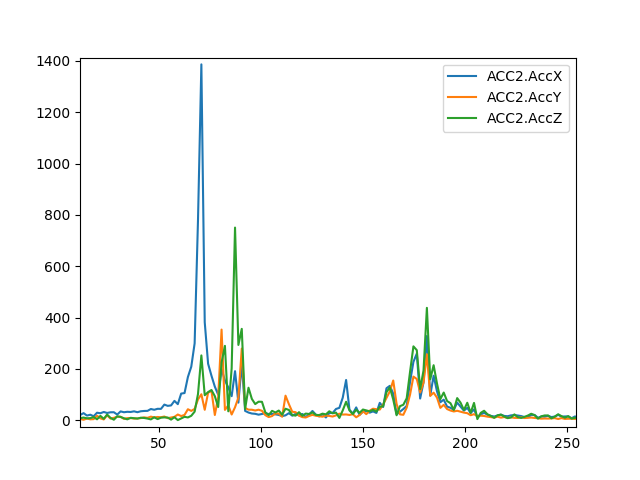
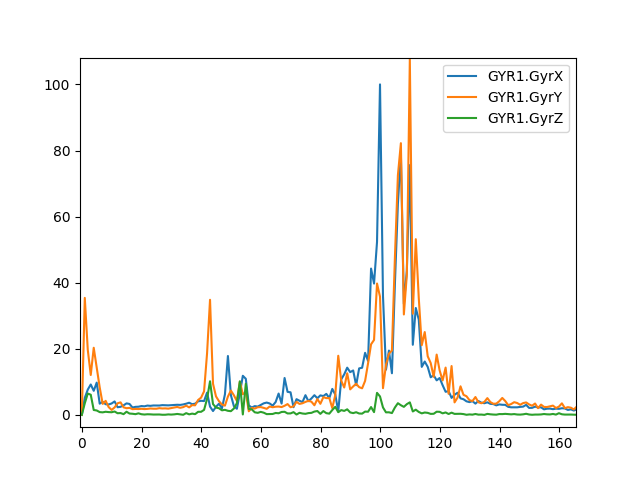
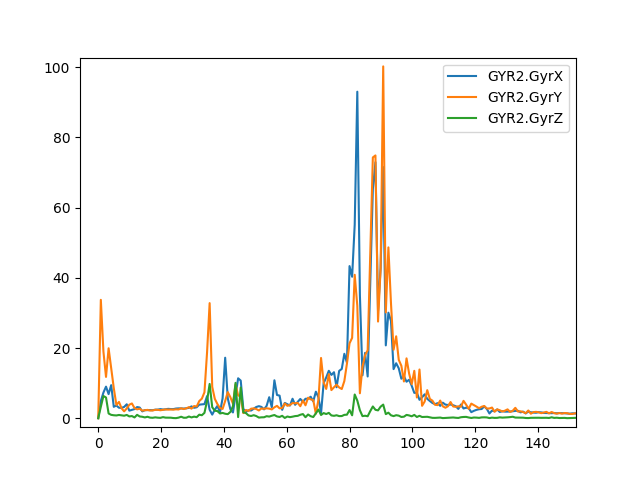
To apply the notch filter, I did a FFT on ACC and GYR raw data and found this situation before enabling the filter:


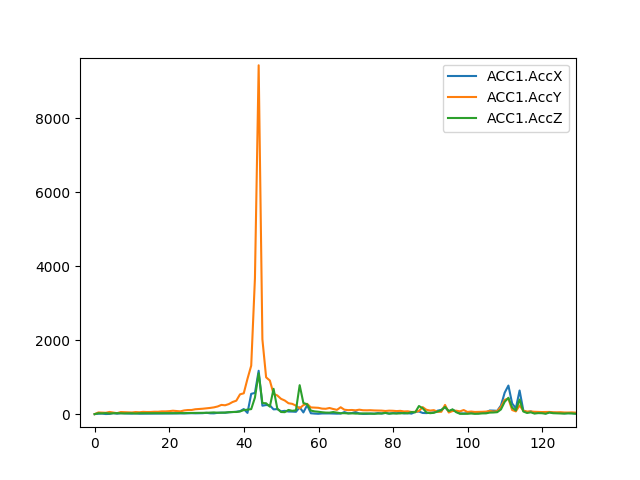
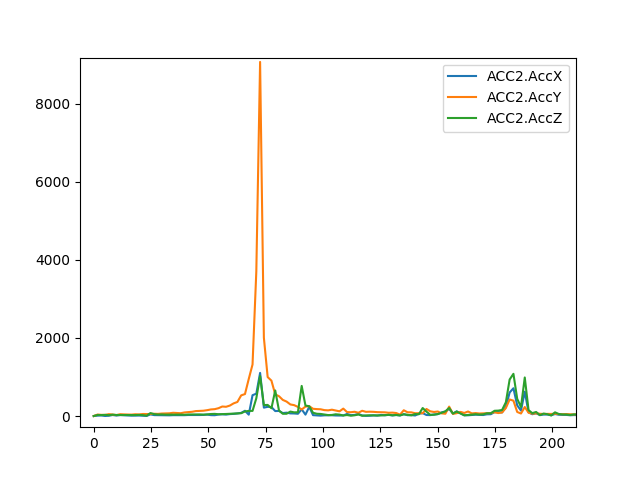
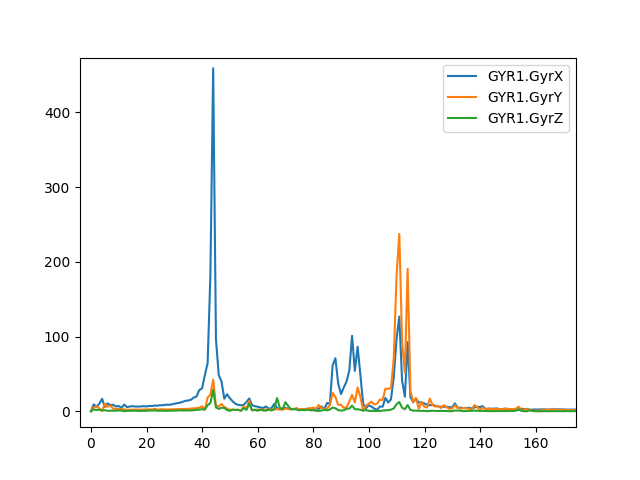
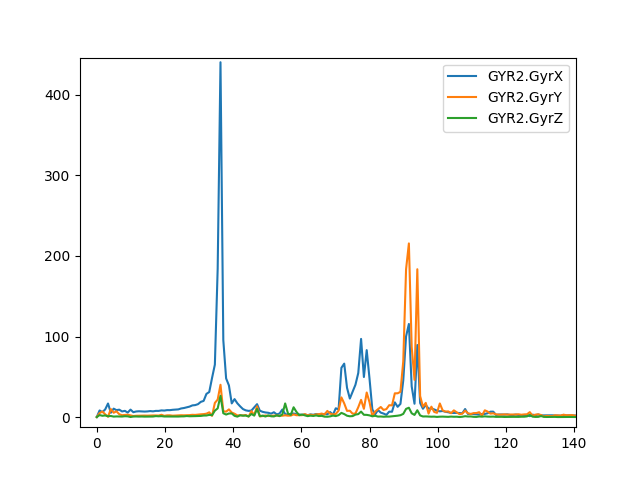
Based on this data, I tuned the notch filter to 40.5 Hz center frequence (in the middle between GYR and ACC peaks), 10 Hz bandwidth and 15dB attenuation.

This is what I got thereafter:


After enabling the notch filter, I was able to crank up the D value from 0.003 to 0.0045 without triggering oscillations (0.005 is the limit).

Conclusion: the IMU notch filter is a mighty tool, making at least my vehicle to run smoother and more agile than ever before. No issues found so far in more than one hour en-route flight (mostly Auto pattern @ 7.5 m/s, but also some climbs, rapid descends, PosHold, Loiter). And last but not least, most “vibration” (in the sense of the VIBE messages) is obviously not caused by unbalanced props, motors or aerodynamics, but control loops :wink: .

Open question 1: where does the difference in observed resonance frequency between GYR and ACC come from?
Open question 2: why 36…45 Hz when the RPM is around 3100 rpm (51.6Hz)? Is there some aliasing going on?
Idea for further improvement: more than one notch filter. At least my vehicle seems to have different resonance frequencies on X and Y axes.

Regards,
Holger

2 Likes

@hsteinhaus Thats very interesting.
@Leonardthall I see you have designed this filter, do you have recommendations on tuning the notch filter for PID optimisation ?

@hsteinhaus Can you post your logs. I don’t understand why you are getting different frequency peeks on IMU1 vs IMU2. Or am I missing something?

@ppoirier The notch filter has two functions.

Filtering noise from the propellers, normally a ratio of their RPM. Unbalanced props oscillate at their RPM but most Z oscillations are caused by blade passage frequency of No_blades x RPM.

The other application is reducing the gain when there is a frame or payload resonance that is limiting the performance of the PID loop.

I hope to have some system identification stuff in there to make this easier. @bnsgeyer has already got this working.

1 Like

What is interesting about this as well is the fact that after applying the notch filter at 40.5 hz, as expected there was a attenuation in the IMU1 acc y but there was the same attenuation in the IMU2 acc y signal that was at a different freq. The peak magnitudes for the IMU 1 & 2 acc y are almost identical before and after the filter is applied except they are at different frequencies.

@Leonardthall
the different frequency between IMUs (as weel as between gyro and accels) are really a interesting questions. I have absolutely no idea where this is coming from. May be a some kind of aliasing? Full log is still uploading, the file is pretty big as the flight was an hour or so. Will send you a message.

@bnsgeyer
The center frequency of the filter was put into the middle between the 44.8 and the 37.2 Hz, so it is off by the same amount to both dominant frequencies.

@hsteinhaus it appears that the freq on IMU 2 acc y signal is closer to 75 hz. That is not as close as the gyr signals. So I would expect the attenuation of that signal to much less than the IMU 1 acc y. So without seeing the data, I think this could be a logging issue with time. The signals look identical between IMU 1 and 2. Or it could be a data reduction issue. @hsteinhaus did the software determine the freq axis of the FFT for you? What software product did you use to do the frequency analysis?

@Leonardthall or @rmackay9. I am seeing pretty consistent gaps in the 400 hz data that was logged under the RATE message. These gaps in data are on the order of 0.2 to 0.3. I was seeing similar gaps of 0.02 in data on the Raw IMU which is sampled I’m guessing around 1000hz that @hsteinhaus collected. I don’t think the gaps should be that big.

Are you using a fast sd card?

So I looked at these logs and my output shows these being consistent.

In the 13 logs I get:
X a peak at 51 Hz and 105 Hz
Y a peak at 112 Hz
Z a peak at 76 Hz

In the 14 log there seems to be only the 100 Hz noise and it is generally at a lower value. The background noise seems much less.

So I think there is a post processing problem with the results you are showing here and not a logging problem. I have not seen any dropped samples so I am not sure why your results are not consistent. Mine have been been consistent from imu to imu.

@Leonardthall I hadn’t even done the Fourier analysis. I was just looking at the raw time history dara. When I look at instrumentation data, I realize that the time interval between samples will not be exactly constant down to the microsecond but I expect that it doesn’t vary by more than a percent or two of the sample rate.

So I don’t think that I am using a high speed SD card. Did 3DR typically ship their Pixhawk twith high speed SD cards? I probably doubt it.

Very interesting results, BTW they are matching much better to the actual prop speeds. Could you describe your workflow for processing? I just relied on mavfft.py (part of pymavlink), limited to one second of log data that I considered complete and undisturbed. Maybe this approach is a bit too naive.

Regarding SD card: I think the card I used was the original one supplied with the Pixhawk 2.1 (8GB Kingston). I did two more flights today with a different card (SanDisk Extreme), but logs are still to be looked on.

Holger

@Leonardthall Here is a histogram of the time intervals between samples for Holger’s first log file. This is for the ACC2 message for a time span of 100 seconds. I used the time tag on this message to determine the time intervals between samples.

Is this typical for logged data. 8 percent of the data was logged at a rate other than the primary sample rate of ~700 hz. 4 percent was at time intervals equivalent to a sample rate of 13000 hz with the other 4 percent at time intervals equivalent to rates from 300 hz to 3 hz. I’m not sure how this would affect frequency analysis since FFT algorthm’s typically expect data at constant intervals.
@Leonardthall I would be interested in a log file from your aircraft with raw logging on so I could see the histogram of time intervals.

Ok, I have to eat a big serve of humble pie. I didn’t look properly before I spoke. I apologise!!

I had a closer look at the logs (as opposed to not seeing the same issue you saw and assuming it wasn’t my initial theory of dropped samples then not checking further).

The PM - LogDrop logs show tens of thousands of dropped log entries. This is a classic slow SD card issue. If you are doing RAW logging you need the fastest card you can buy.

There are less logs dropped in the 14 log and that is probably why the graphs look cleaner with a lower noise floor. I apologise again for rushing my analysis and doing some sloppy work here!

13 Log

14 Log

No worries.

What is PM-LogDrop. Is this a tool in the Ardupilot tool directory?

It is one of the log entry. It records how many lines had to be dropped because the sd card, or something else in the data chain, could not keep up.

The different frequencies problem has been fixed by a recent commit. :slight_smile:

Sorry I didn’t answer your question Bill.

PM-LogDrop is the message in the data flash logs that lets us know how many messages have not been written to the log because the SD card can’t handle the rate.

Thanks for the response Leonard. I did figure that out. I never got even the high data rate capable SD cards to work for the 400 hz logging. I took the 25 hz and changed it to a 50 hz for the frequency domain characterization work I was doing. It seemed to be ok with 50 hz but I had to get rid of all of the EKF messages. I would like to get the 400 hz working because i could then see and deal with any aliasing that may be occurring. I’ll probably get back to that after we finish up the spool logic stuff

Chibios will make this much more reliable. We also have some other logging capabilities in the pipeline associated with the FFT stuff that may help us further there too.

That’s one’s actually deprecated - at least on master :slight_smile:

https://github.com/ardupilot/ardupilot/blob/master/libraries/DataFlash/LogStructure.h#L141