@Leonardthall had mentioned his desire to start characterizing both multicopters and helicopters in the frequency domain. I am opening this topic to be the discussion thread for those participating in this characterization work.
Leonard was looking to provide a number of excitation signals to include Chirp function, sinusoide stepped in frequency and Maximal length BPSK sequence. I have incorporated a chirp function in Copter 3.5.3. I was able to run some test flights with my Ergo flybarred heli and get some frequency response data.
Aircraft and Setup
Ergo .46 converted to electric
E-flite 700 heli motor
Castle Creation 80Amp 50VDC ESC
12s 5000mAh Lipo batteries
rotorspeed: 1800 RPM
blades: 600mm
rotorhead: Miniature Aircraft X-cell 30 2 bladed flybarred head
weight: 10.5 lbs
swashplate servos: Futaba 3050 digital servos
Here is a graph of the input chirp function and the output to the mixer. It increased in frequency from 1 to 60 rad/sec over 90 seconds with an amplitude of 0.08 on Rout.
So I conducted the chirp in both the pitch and roll axes. The data was collected at 400 hz using the fast ATT logging bit. I had added the sweep as a signal that was logged with the RATE data. The data was processed using the Student version of CIFER. I had it down sample the data to 250hz for the analysis.
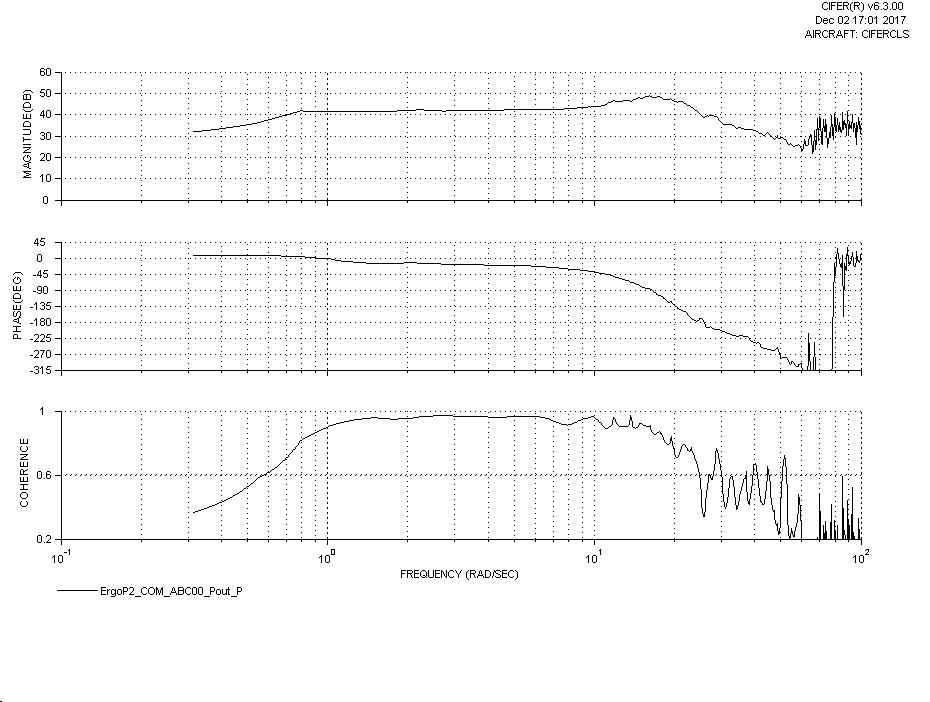
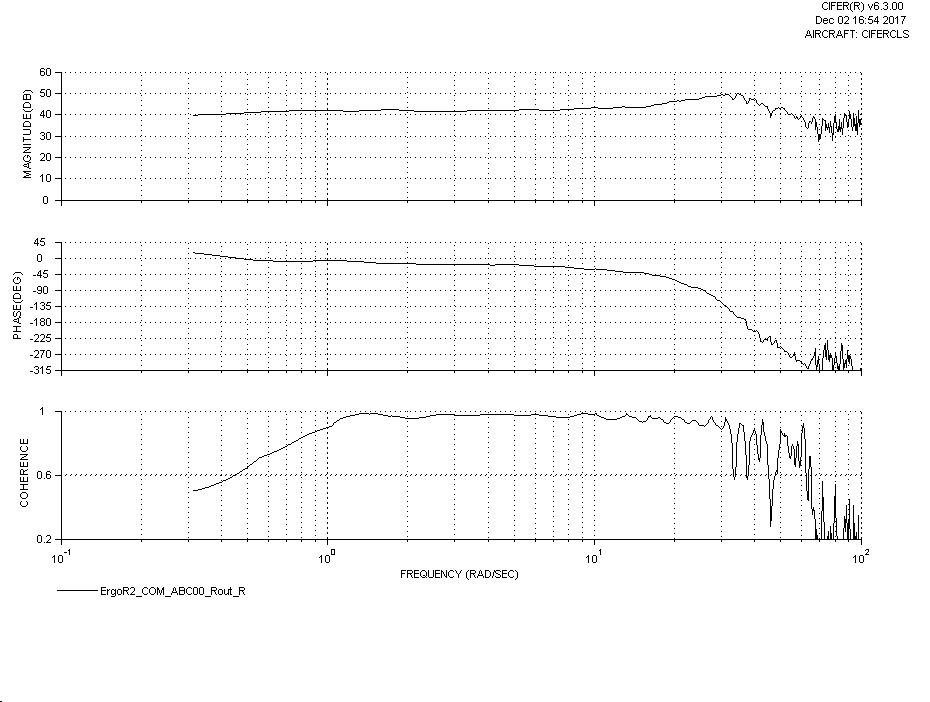
Here is the bode plot for the pitch axis
It is interesting to see the hump in the top plot (gain plot) in both axes which is indicative of a lightly damped oscillatory mode. so if the controller was to drive the aircraft at that frequency then you could see some oscillations. It can also be noted that the roll axis has a greater bandwidth (follows your inputs up to higher frequencies) than the pitch axis which is expected. One of my questions is whether the magnitude and phase drop at higher frequencies is due to the servo or the aircraft. I don’t know what the frequency response of these servo are.
So I have a Y6 multicopter and I am interested to see how frequency response compares to these.
I hit the heart 5 times but it kept going on and off
There is a problem with your graphs though. It looks like the program has not factored in the magnitude of the input signal and you are getting 40 dB gain when it should be more like 0.5 dB.
For stability the bode plot should be going negative in magnitude when the phase goes through 180. If it doesn’t then it will be shaking!
Great work!!
Edit:
Ok, I looked at the code. You have allowed the user to choose either rate request, or output to the mixers as the input location. NICE! To make it generic I will try to let it also go to the angle request.
Starting with using the 400 Hz logging (or the rate controller loop frequency) functionality is a good starting point. We can always enable RAW logging to look at step responses at higher frequencies but I doubt there will be much information to learn there as I don’t think we have the ability to excite a response up there yet.
I will need to chat to Randy about how to best structure this so we can make the characterisation a separate library and drive it all using an Autotune like mode.
I believe this is a scaling issue. I didn’t scale the Rout signal to what that translates to in blade cyclic angle. I think if it was properly scaled then the gain plot would make more sense.
@Leonardthall I loaded my custom firmware with the automated chirp on my Y6. I got a few flights completed and successfully flew pitch and roll chirps. Unfortunately I didn’t set the log_bitmask correctly and the data rate was too slow. So I have to refly and analyze the data. Hope to get to it next week.
I had the opportunity to conduct some frequency response testing this morning on a 3D Robotics Y6 multicopter. Here are the specs on this aircraft.
weight: 4.2 lbs
engines: six SunnySky 2830-12 850kv
propellers: APC 10X4.7
battery: Thunder Power Pro Lite+ Power Series 14.8V 4s 4,400mAh lithium polymer battery
The chirp was set up to run 100 seconds and vary frequency from 1 to 80 rad/s with an amplitude of 0.1 on Rout and Pout. The data was collected at 400 hz using the fast ATT logging bit. The data was processed using the Student version of CIFER. I had it down sample the data to 250hz for the analysis.
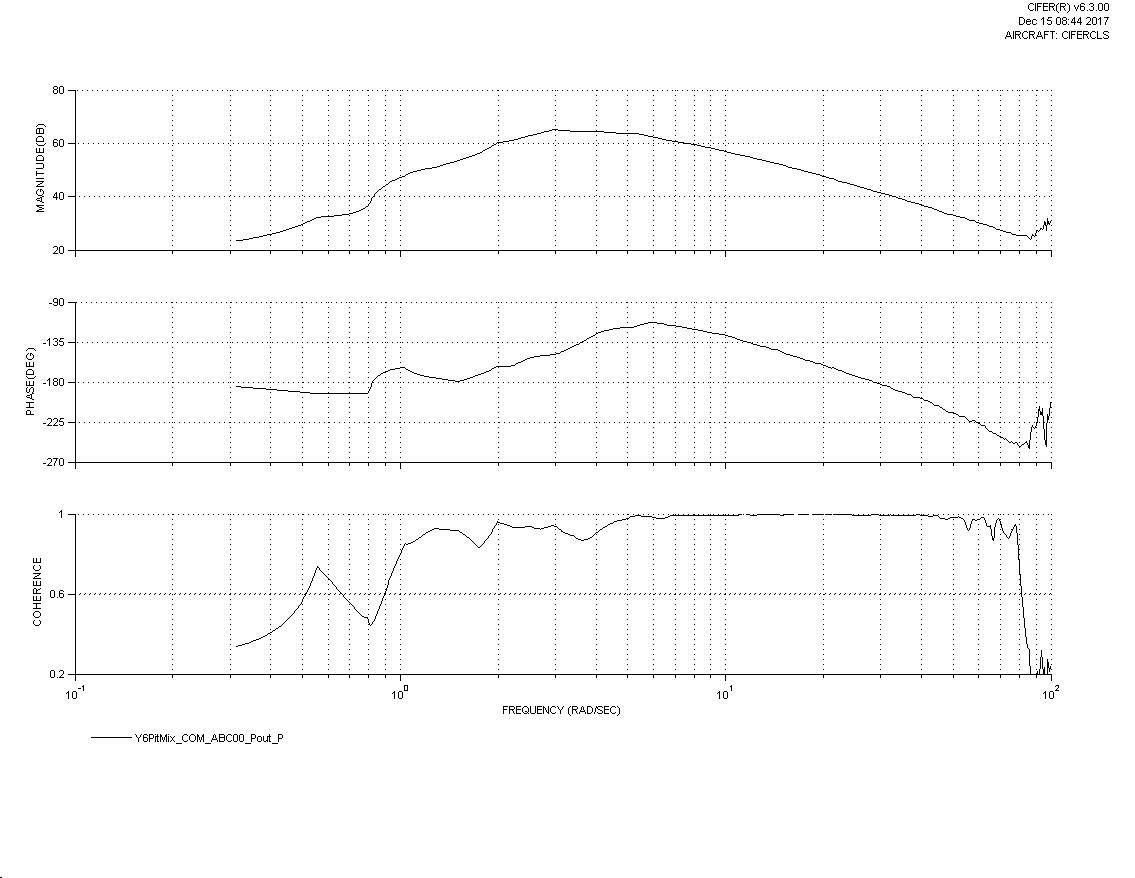
Here is the bode plot for the pitch axis
@Leonardthall even though I ran the frequency sweep from 1 rad/s through 80 rad/s, you can see that I have poor coherence up to about 4 rad/s. I’m not sure why that is. I did make some inputs to keep the aircraft from getting too far away from me. Also is this really representing raw aircraft dynamics or is there some feed forward shaping that you are doing in the motors class? Do I need to change any of the MOT parameters that may affect getting the raw aircraft dynamics?
Thoughts? Is this what you expected for a frequency response?
So there are a couple things going on her. First up for the lower frequencies the attitude controller is can cancelling your excitation function. This is probably why your coherence is poor at lower frequencies. Keep in mind that 10 rad/s is 3 Hz. So you are not really interested in much below 3 rad/s or half way along the graph.
This is why I felt we needed to enable the excitation signal to be applied to the angle, rate, or RPYTout. For example, if we apply the excitation to angle then we will get great definition at the lower frequencies because the attitude loop will ensure we get maximum output rather than minimum. The problem with using the angle as the input is the filtering will prevent characterisation at the high frequencies because the filtering will attenuate the signal. It is worth noting that at very low frequencies we will still have poor coherence because the outputs must be kept very small or we will flip over.
So what you have here looks like a good representation of the upper control band and out of control band range. If you passed this into the angle instead I would expect to see the phase increase up to 0 and the coherence be better down lower. It is interesting looking at the crossover of 180 degrees at 6 Hz. I have never seen that measured before!
The other thing we should look at is comparing this to the raw logging output of the IMU so we are not effected by the IMU filters. The IMU filters at 20 Hz will provide a significant phase offset at 6 Hz still.
Ok. So in my haste I had the wrong input type. It was for a disturbance rejection analysis. So what I have is still a good analysis of the raw dynamics of the aircraft but as you pointed out the control system was modifying the input and causing the coherence to be low. It is tough trying to get flights in during the week since it is winter and it gets dark before I get home from work so it is difficult squeezing in flights during the week. So I will try this again later this week. I’m curios to see what the low frequency looks like.
By the way, this input type makes the sweep input to the attitude signal going into the attitude controller. So you can do your analysis looking at the input to the attitude controller.
I really thought that multi’s were more acceleration response (phase of -90) throughout the low frequency regime but this is showing that they have a phase closer to -180 deg.
I believe they do and the problem is the excitation does not have enough resolution at the lower frequencies and there is distortion due to start up. I don’t think your results are accurate below 5 rad/s.
This is where the design of the sweep is important. By using a linear chirp you get increasing SNR at the higher frequencies at the expense of the lower frequencies. By chirping at a rate proportional to the frequency the SNR will be constant until the control loops cancel things out at the lower end.
So at low frequencies you have a low SNR because of the short time relative to a period you spend on those frequencies and the cancellation of those frequencies by the control loop.
Ok. Interesting. Well I thought the coherence would speak to the quality of the signal and whether there was enough SNR. Well what I’ll do is perform another chirp that will be 100 seconds long and go from 1 rad/s to 6 rad/s. I’ll also increase the amplitude to make sure there is enough SNR.
So I’ve been using multiple windows for the FFT’s in CIFER and it has a feature that combines the FFT’s with different windows. At this point I’ve been doing 20 sec, 10 sec and 5 sec windowing. Then I have it combine the spectral results to one composite spectral analysis result.
Also you had mentioned the effect of the 20 hz LPF on the rate signal on the results of the analysis. Should I filter the input at 20 hz before doing the analysis to negate the effect of the LPF on the rate signal?
Yeh, I am not familiar with that software so I don’t know what that represents.
You could do that. I intended to just take the raw IMU data before filtering. So you could turn on RAW logging and use that. You would need to downsample the data though.
From what I know about spectral analysis coherence is the goodness of how well the output correlates with the input. Typically, any value above 0.6 is considered good correlation. A value of 1 indicates perfect correlation. I would imagine you know this. As for the accuracy of the phase, I guess good correlation doesn’t necessarily guarantee accurate phase estimation. I will still plan to get the data for the low frequency range. Hopefully that will shed some light on this.
So True! I will be taking a course in January on CIFER. Part of it is learning how to determine a lower order system from the spectral analysis results.
I think the first chapter “Definition and Formulation” of the given link says it all about the coherence
I think you would want to find a means to have error bars on your data in the plots. E.g. in the data plots in the first post, the reason for the drop in coherence at low freq can IMHO be very clearly seen: from the Bode plots its clear it’s due to a drop in magntiude, and when you look into the data trace one clearly can see lots of noise in the first few cycles, and in fact a kind of a “jump” after ca. 6 cycles there it kind of “snaps in”.
Looking at this it could be maybe worthwhile to test if it could help to prepend the sweep by e.g. 10 cycles of constant frequency, in order to give the system some time and/or account for slow transients