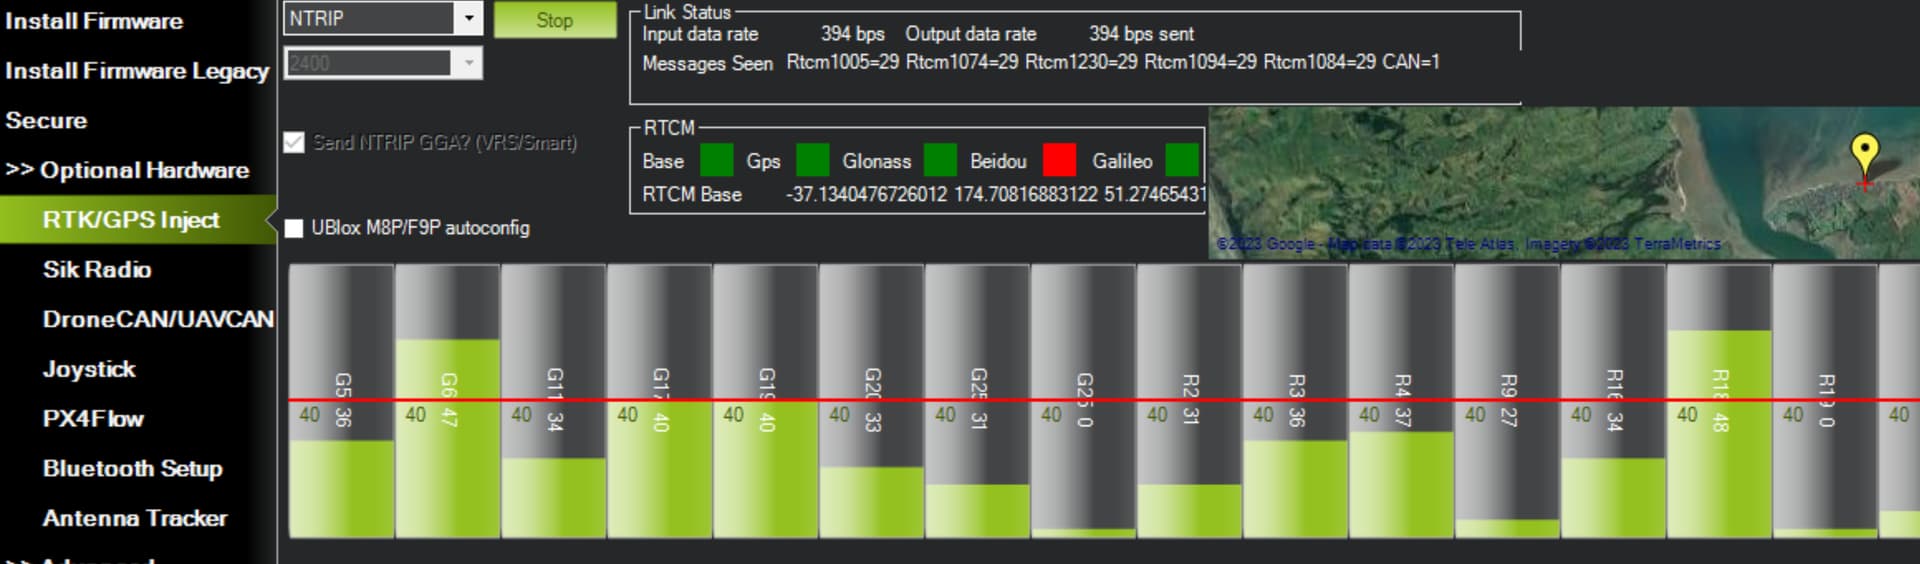
Hi, I’ve just set up my own NTRIP server and getting my head around how to manage its accuracy. Can anyone please shed some light on how to read the following display on mission planner (ps - its all working, good RTK FIXED on the rover, just accuracy questions) - specifically how to read the bar graph…
The bar graph shows reception quality for each satellite used by the base station. The red line is a 40dB threshold (the usual threshold for “good” reception of a given GNSS signal). In general, seeing the bar graph is quick confirmation that you’re getting valid RTCM3 messages. It’s hard to get a real qualitative analysis beyond that from just the info displayed, though fewer and shorter bars are vaguely indicative of worse performance than more and stronger reception.
You can also see constellations in use and message rate. As long as the message counts are incrementing at about 1Hz, the data rate is likely adequate (and, in fact, is a somewhat meaningless statistic based on a review of the code - it’s more indicative of message size than it is actual throughput).
Thanks - that makes sense and helps.
The bargraph above is with my basestation F9P with survey antenna on the window sill - with very little view of the sky. I fired up the mower, approx 2km away using the NTRIP server - and at best got a 6,5 lock - RTK FIXED, RTK Float which is meh.
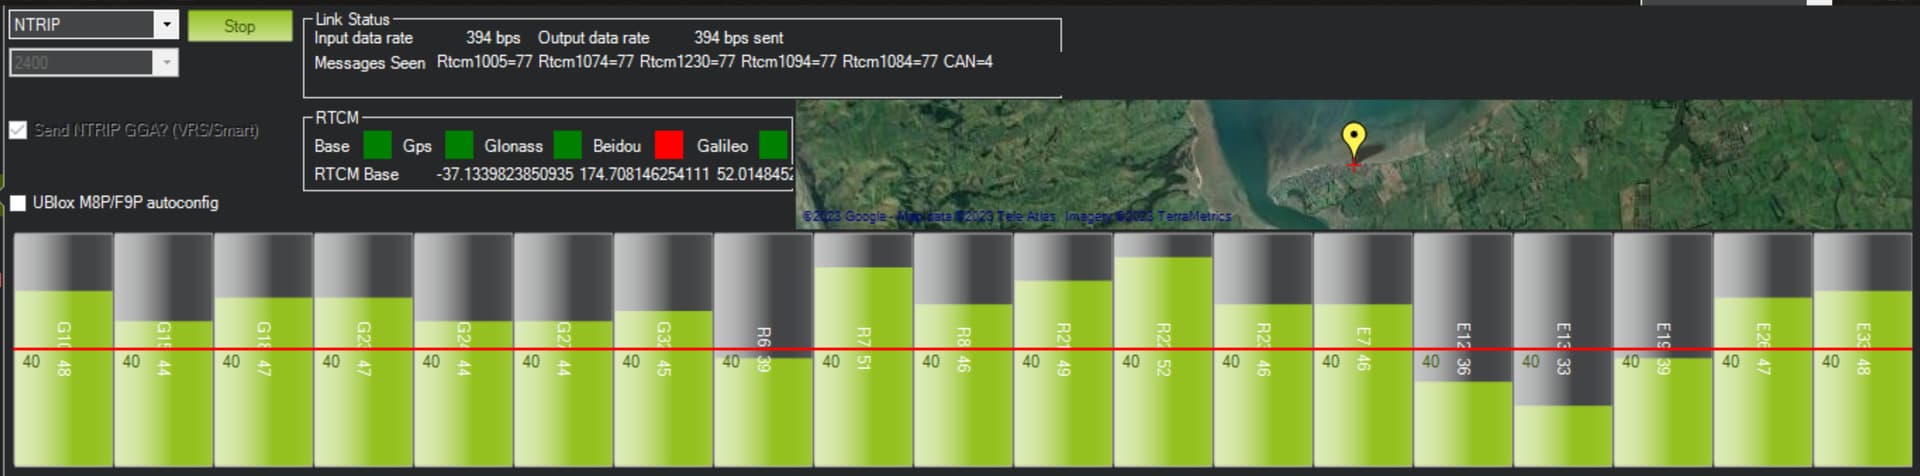
Moved to the lawn - with trees around but not above and got the following. Knowing the red line 40dB rule gives me confidence in the following. Next job - weather proofing the antenna and connections… then up on the roof.