nagordon
September 6, 2021, 5:25am
1
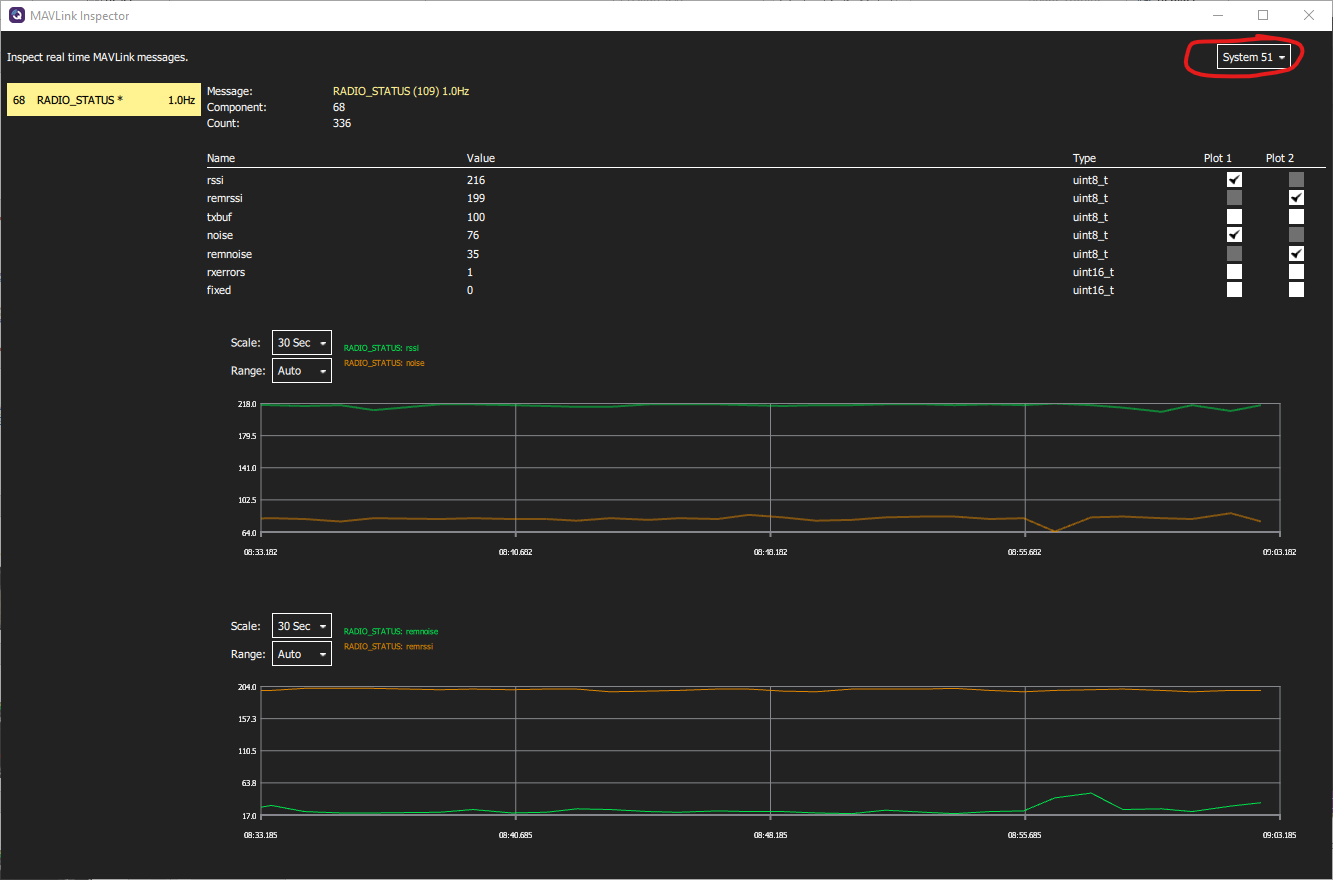
When using Mission planner or QGroundcontrol, I can plot “RADIO_STATUS.rssi”, but when plotting with mavproxy via “graph RADIO_STATUS.rssi”, nothing is plotting. I noticed in Qgroundcontrol, I need to select “System 51” (see image) to get access to the RADIO_STATUS values. Any ideas on how to plot in MAVPROXY?
Thanks
nagordon
September 15, 2021, 3:05am
3
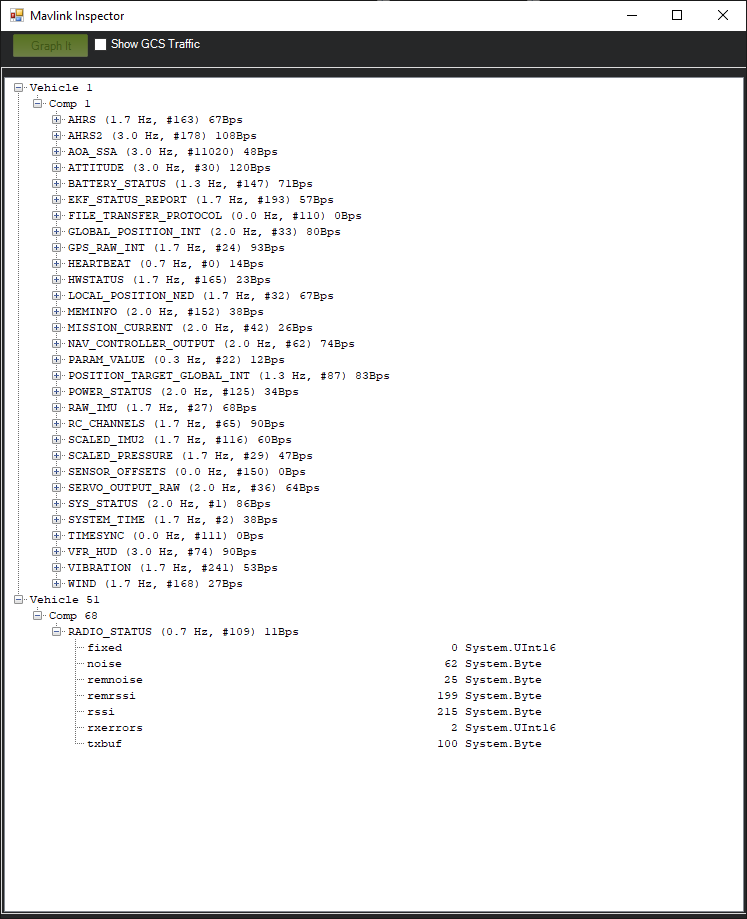
I also noticed Mission Planner has them as separate vehicles, but combines them in the tlog.
It is odd that when you try and plot in MAVPROXY there is no data. For example
C:\Users\neal>mavproxy --master=tcp:127.0.0.1:14550
Connect tcp:127.0.0.1:14550 source_system=255
Loaded module console
Running script (C:\Users\neal\AppData\Local\.mavproxy\mavinit.scr)
Loaded module help
Unknown command 'graph timespan 30'
Log Directory:
Telemetry log: mav.tlog
Waiting for heartbeat from tcp:127.0.0.1:14550
RTL> module load graph
Loaded module graph
RTL> graph
SYS_STATUS                 SCALED_IMU2                VIBRATION                  HEARTBEAT
POWER_STATUS               SCALED_PRESSURE            POSITION_TARGET_GLOBAL_INT GLOBAL_POSITION_INT
MEMINFO                    GPS_RAW_INT                BATTERY_STATUS             PARAM_VALUE
NAV_CONTROLLER_OUTPUT      SYSTEM_TIME                BATTERY_STATUS[0]          SENSOR_OFFSETS
MISSION_CURRENT            AHRS                       ATTITUDE                   TIMESYNC
SERVO_OUTPUT_RAW           HWSTATUS                   VFR_HUD                    legend
RC_CHANNELS                WIND                       AHRS2                      timespan
RAW_IMU                    EKF_STATUS_REPORT          AOA_SSA                    tickresolution
RAW_IMU[0]                 LOCAL_POSITION_NED         RADIO_STATUS
RTL> graph SYS
SYS_STATUS  SYSTEM_TIME
RTL> graph POWER_STATUS.
POWER_STATUS.Vcc    POWER_STATUS.Vservo POWER_STATUS.flags
RTL> graph RADIO_STATUS.
RADIO_STATUS.rssi     RADIO_STATUS.txbuf    RADIO_STATUS.remnoise RADIO_STATUS.fixed
RADIO_STATUS.remrssi  RADIO_STATUS.noise    RADIO_STATUS.rxerrors
RTL> graph RADIO_STATUS.rssi
Adding graph: ['RADIO_STATUS.rssi']
and the plot is empty…