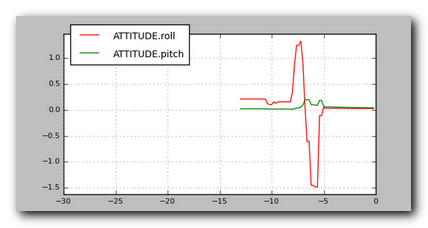
The mavproxy documentation describes using the graph module to graph live data. It shows one example with ATTITUDE.roll, ATTITUDE.pitch.
Where can one find a list of other vehicle attributes that can be similarly graphed? Can vibration be graphed live in the simulation?
I see by Tab Tab graph ‘letter’ and going through the alphabet show it, and this -
https://raw.githubusercontent.com/ArduPilot/MAVProxy/master/MAVProxy/tools/graphs/mavgraphs.xml
https://mavlink.io/en/messages/common.html#FIRMWARE_VERSION_TYPE_OFFICIAL