Holybro Pixhawk 6X Pro
Welcome to the future!
Over the last few weeks I have been working with the team at Holybro on a new flight controller - the Holybro Pixhawk 6X Pro. What is it all about you might wonder? The answer is noise.
If you have watched any of my videos then you will know that I place quite a lot of emphasis on reducing noise in multirotor builds. The reason for this is pretty simple - noise interferes with the operation of a crucial part of any flight controller - the IMU(s). The IMUs generally measure acceleration and rotation rates - so let’s look in a little more detail at what is done with these measurements and how they affect flight performance.
Summary
For those of you who just want the tl;dr in this blog I look in detail at the role of IMUs in measuring rotation and acceleration for drone control. I then go on to describe the various ways in which noise can prevent these sensitive components from working properly and what can be done about it in both hardware and software. I then describe the physics of the Pixhwak 6X Pro and the different ways that its response to noise can be measured. Finally I look at some experimental results for the Pixhawk 6X Pro design using both a vibration table and real flight tests concluding that this is a great step forward in flight controller design.
Alright, on with the show …
How inertial sensors are used to control Vehicles
Acceleration
Measuring acceleration allows a vehicle to perform inertial navigation. In the simplest case when the vehicle is stationary there will be no acceleration in the horizontal axes (X&Y) and the force of gravity in the up-down (Z) axis.
When the vehicle starts to move it has to accelerate to do so. By integrating the measured acceleration the vehicle velocity can be estimated. Repeating this process and integrating velocity its position can be determined. The same algorithm can be applied in the Z axis - measured acceleration can be used to determine whether the vehicle is going up or down and the altitude. The EKF does all of this using some clever maths and data from other sensors that might be relevant to determining overall velocity, position etc.
Excess vibration kills all of this.
Vibration is essentially a rapid back and forth movement, so the vehicle is constantly accelerating and decelerating. This acceleration is not part of the overall motion of the vehicle that we are interested in for flight control, so the EKF has to somehow filter it out. The more vibration the harder this gets. It gets particularly bad when “clipping” occurs. Clipping is when the actual acceleration is greater than the limits of the sensor. The sensor limits are measured in g’s - so a typical sensor might have 16g limits. On very noisy builds with excess vibration these limits are exceeded and clipping occurs - the sensor reads 16g but the actual value is higher than this. This is very bad for the EKF because it can no longer integrate the acceleration values to arrive at sensible answers for velocity and position.
This is generally what causes flyaways.
You can see estimates for vibration and clipping by looking at the VIBE log messages in a flight log. So noise is universally bad for the IMUs measuring acceleration and the EKF as a whole.
Rotation
Measuring rotation rates means that it is possible to tell how fast a vehicle is spinning. In a similar way to acceleration the rotation rate can be integrated to determine angular position and differentiated to determine angular acceleration. These three components in each of three axes comprise the attitude of a vehicle - and control of the attitude is what allows vehicles to turn, flip and respond to disturbances such as wind and propwash.
Excess rotational noise - usually caused by vibration - kills all of this.
In a similar way to acceleration - noise means that the attitude cannot be determined accurately and results in poor performance or even crashes. The attitude controllers will react to noise as if it is pilot input and cause the vehicle to bounce and weave. In pathological conditions PIDs that are too high can cause the noise to be amplified so that all control of the vehicle is lost. This is why tuning vehicles with a lot of noise requires lower PIDs to avoid this possibility - but lower PIDs also compromises control.
Handling noise and vibration
Vibration and noise are bad - so how should they be handled?
The primary - really the only - way to handle these two is via filtering. Filtering can be done in software via digital IIR filters and in hardware via vibration isolation mounting.
So why don’t we just mount our flight controllers on really soft foam and set our software filters really aggressively? Well there is a problem - the more we filter the less movement is observed by the flight control software - and a lot of this movement needs to be measured in order to effect good flight control. This is particularly true for the attitude controllers - these have to react very quickly to movements and instabilities that could cause the vehicle to crash - it’s their speed and responsiveness that makes flying multirotors possible in the first place. Very aggressive filtering means that this precision is simply not possible - the controllers cannot react quickly enough to prevent catastrophe.
So really aggressive filtering is bad for the gyros but lots of noise is bad for control. The accelerometers are generally ok with more aggressive filtering, but there is another problem. All soft mountings have resonance - this is a frequency at which vibration is amplified rather than damped. The stiffer the mounting the higher the resonant frequency, the softer the mounting the lower the resonant frequency. In the worst case the resonance is at a frequency that needs to be measured to do effective flight control.
So what to do? Enter the Pixhawk 6X Pro!
Pixhawk 6X Pro
The premise of the Pixhawk 6X Pro is that Pro users want effective vibration isolation without compromising performance and are prepared to go to a little extra effort to achieve that. The Pixhawk 6X Pro introduces a new kind of IMU vibration isolation that is a combination of special silicone-based vibration absorbing material and mass. Foam and silicon can bed used to filter vibration but so can mass - the heavier the mass the more force is required to accelerate it and this can be used to reduce the effect of vibration.
Here’s how the construction of the Pixhawk 6X Pro looks - the IMUs are attached to a mass which is suspended in soft vibration absorbing silicone:
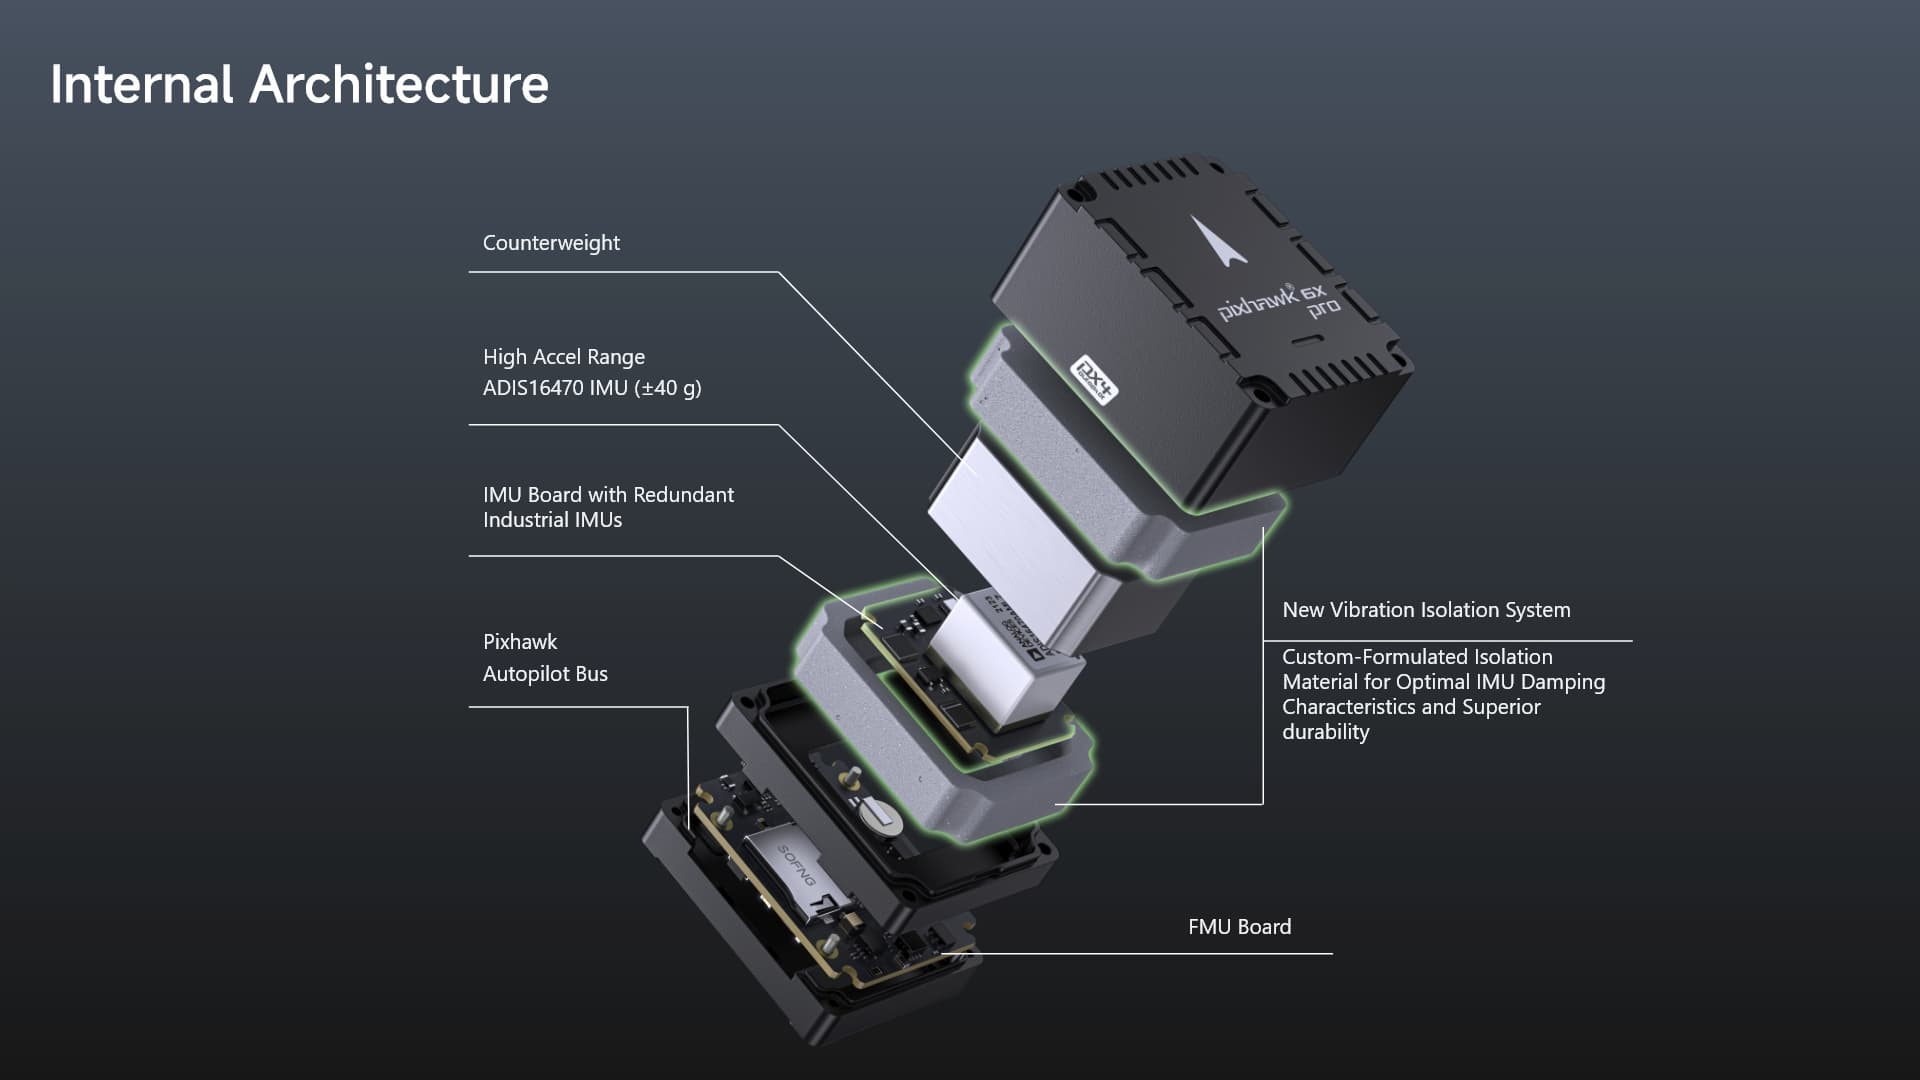
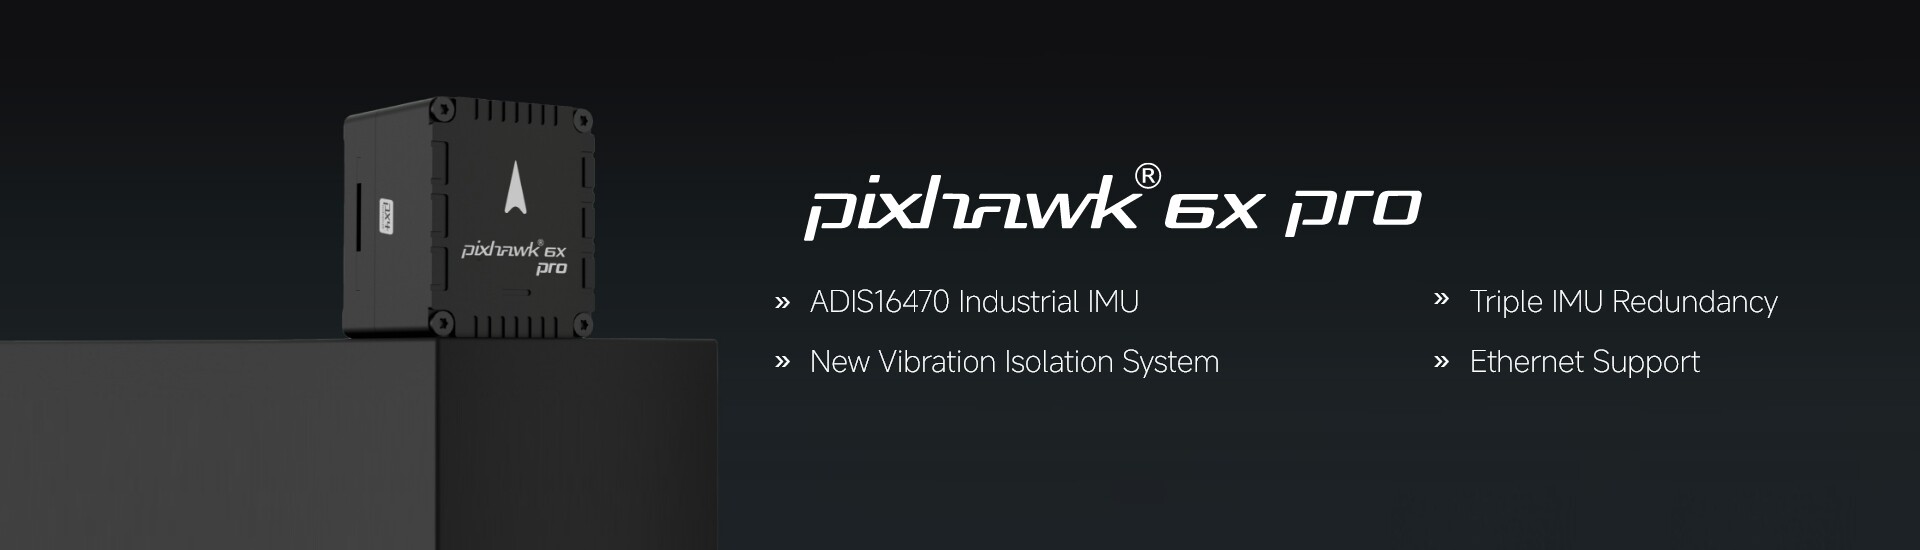
The Pixhawk 6X Pro also includes a high-quality ADIS16470 IMU with a very large dynamic range of ± 40g which can be used to avoid clipping events.
All well and good, but how heavy should the mass be and how thick should the silicon be?
This is where testing comes in. We are trying to balance several different requirements - softer mounting of accelerometers, more rigid mounting of gyros, size and weight.
So how do we go about testing the different options? We obviously can do flight tests, but this is not a very rigorous way of comparing different options as factors like weather can produce different outcomes. Some of you may have seen my video of testing resonant frequencies using a vibration speaker:

there is a more “industrial” way of doing these tests - and that is to use a vibration table. Holybro acquired one of these and did much of the flight controller testing for this analysis:
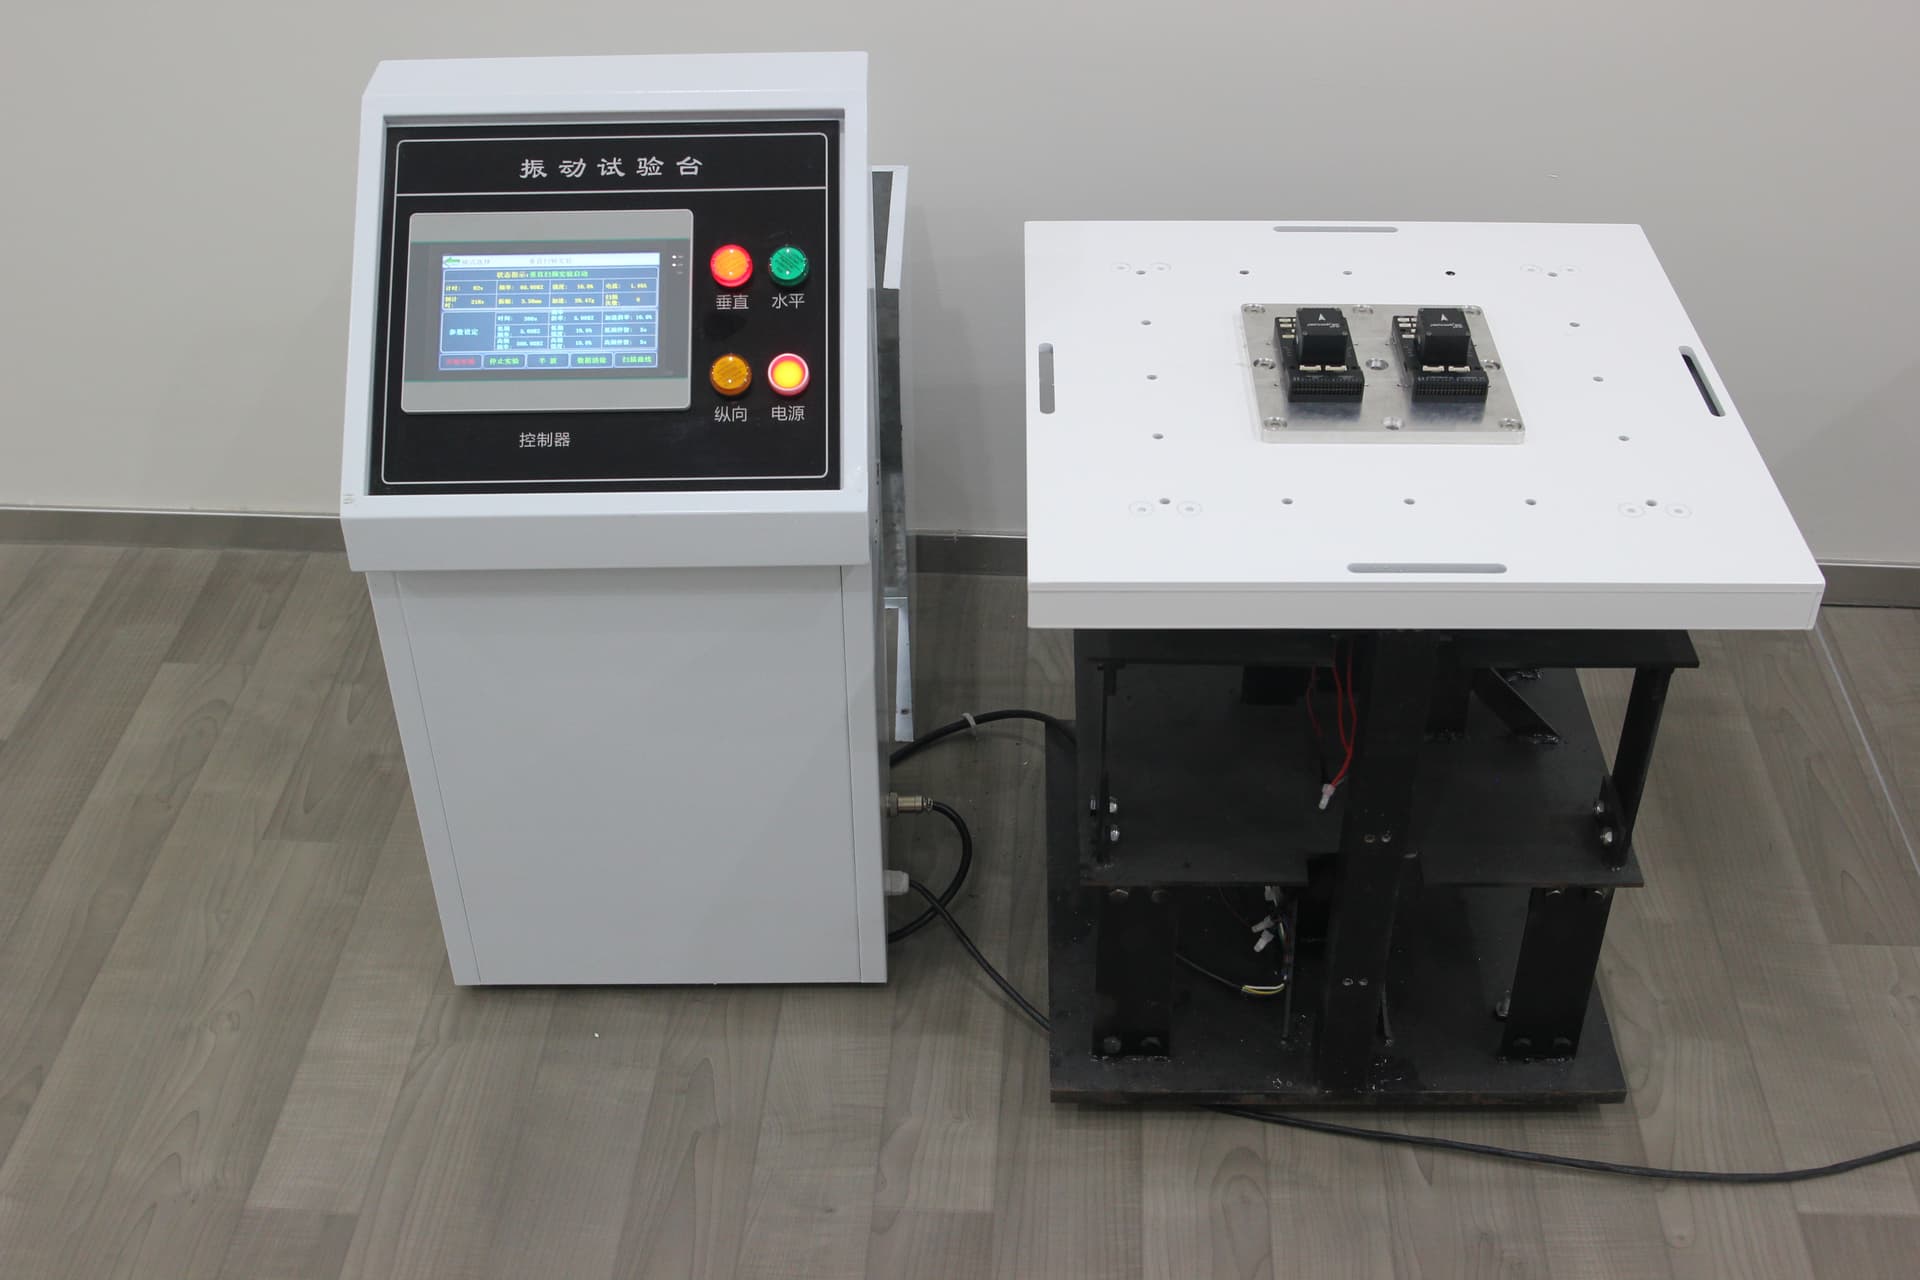

A vibration table can be used to apply vibration in specific directions at specific amplitude. More sophisticated tables can also be used to apply rotational movement to excite the gyros. A vibration speaker, in contrast, can only really effectively apply vibration in a single (Z) axis.
So how are we going to test this? In reality it’s quite simple - we attach the flight controller to the vibration table and apply a range of frequencies on all axes - commonly known as a sine sweep. Typically we want to cover the range of frequencies that is relevant to the IMU, so for example from 10Hz to 500Hz might be quite representative. In order to see the effect we need to switch on disarmed logging, log the gyros at full rate, enable batch logging and enable the on-board FFT so that we can use that to analyse the instantaneous noise. The appropriate parameters are these:
FFT_ENABLE 	1
FFT_MINHZ  	5
FFT_MAXHZ  	495
FFT_SNR_REF 	10
FFT_WINDOW_OLAP	0.75000000
FFT_WINDOW_SIZE	256
INS_GYRO_FILTER 0
LOG_DISARMED	1
LOG_BITMASK	2273278
INS_LOG_BAT_MASK 7
INS_LOG_BAT_OPT 1
Note that we are switching off the gyro filter so that we can see the noise without additional filtering (remember we are only concerned about the effectiveness of the physical filtering at this time).
So how should the logs that this produces be evaluated? There are a number of aspects:
Accelerometer vibration
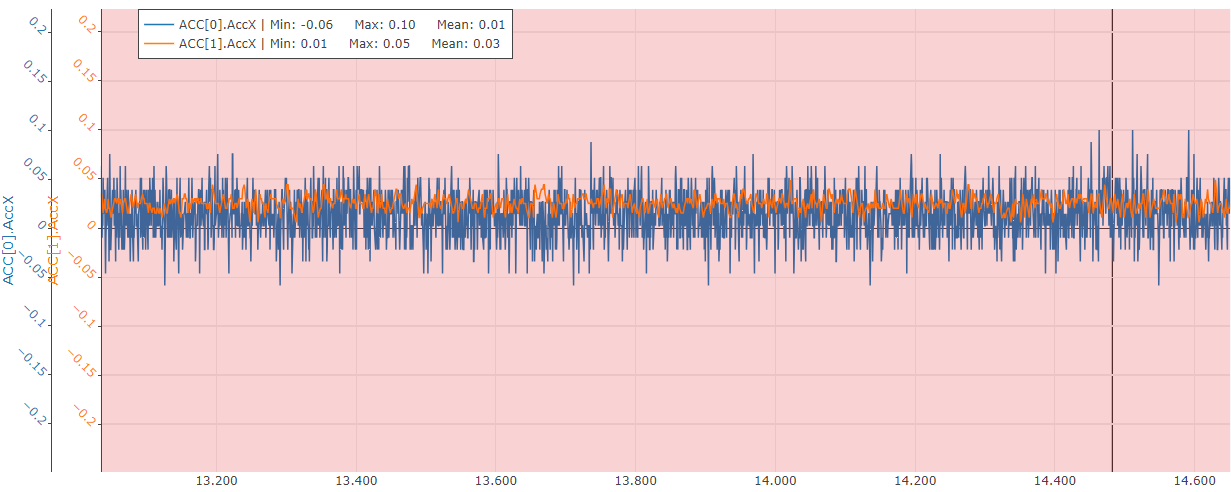
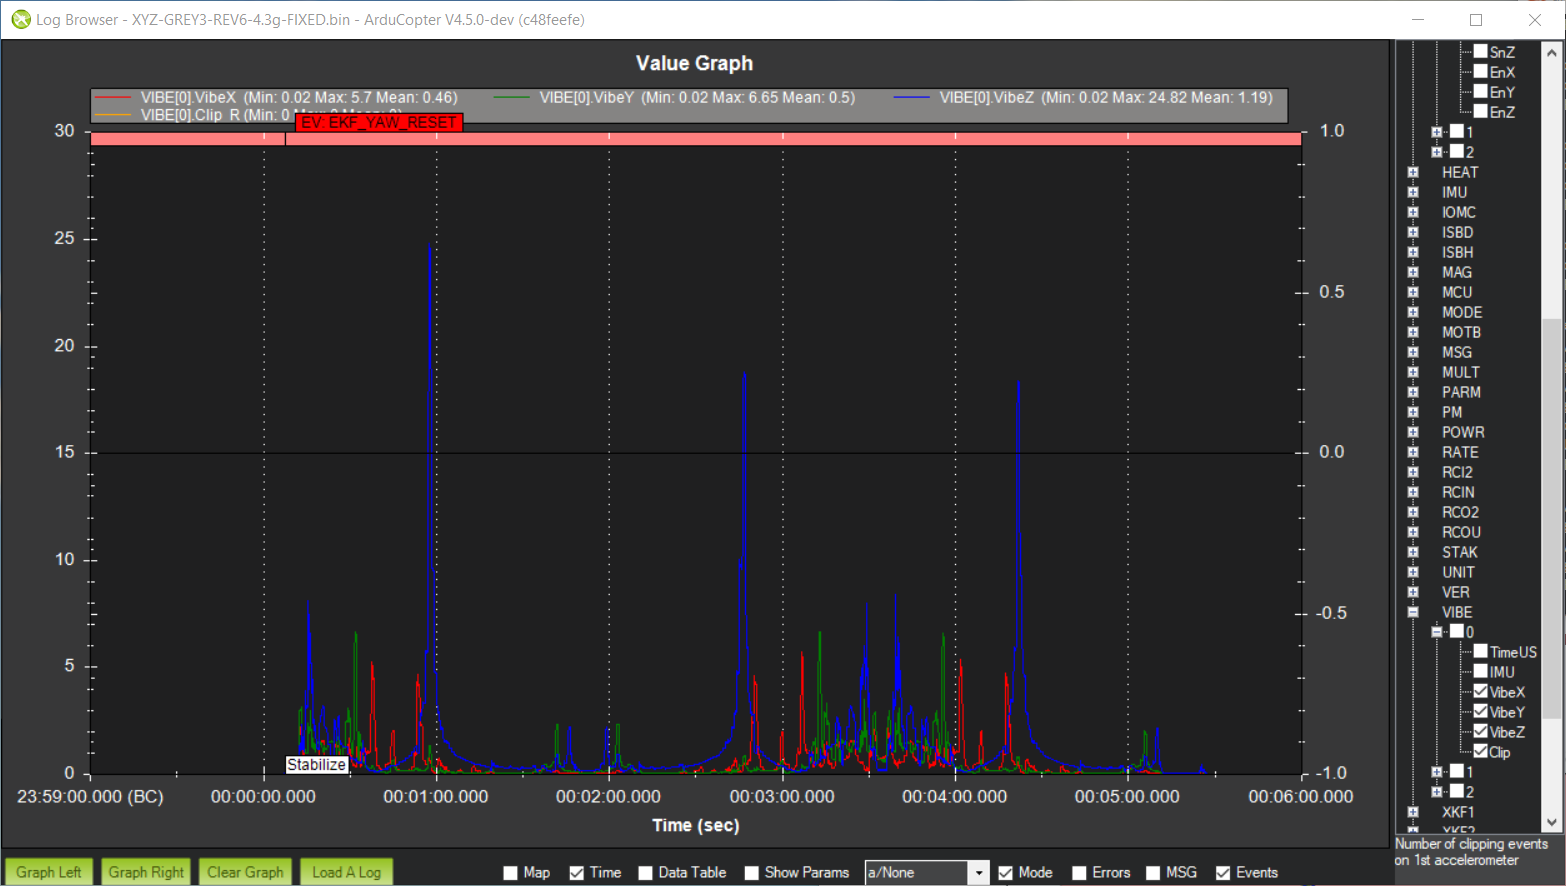
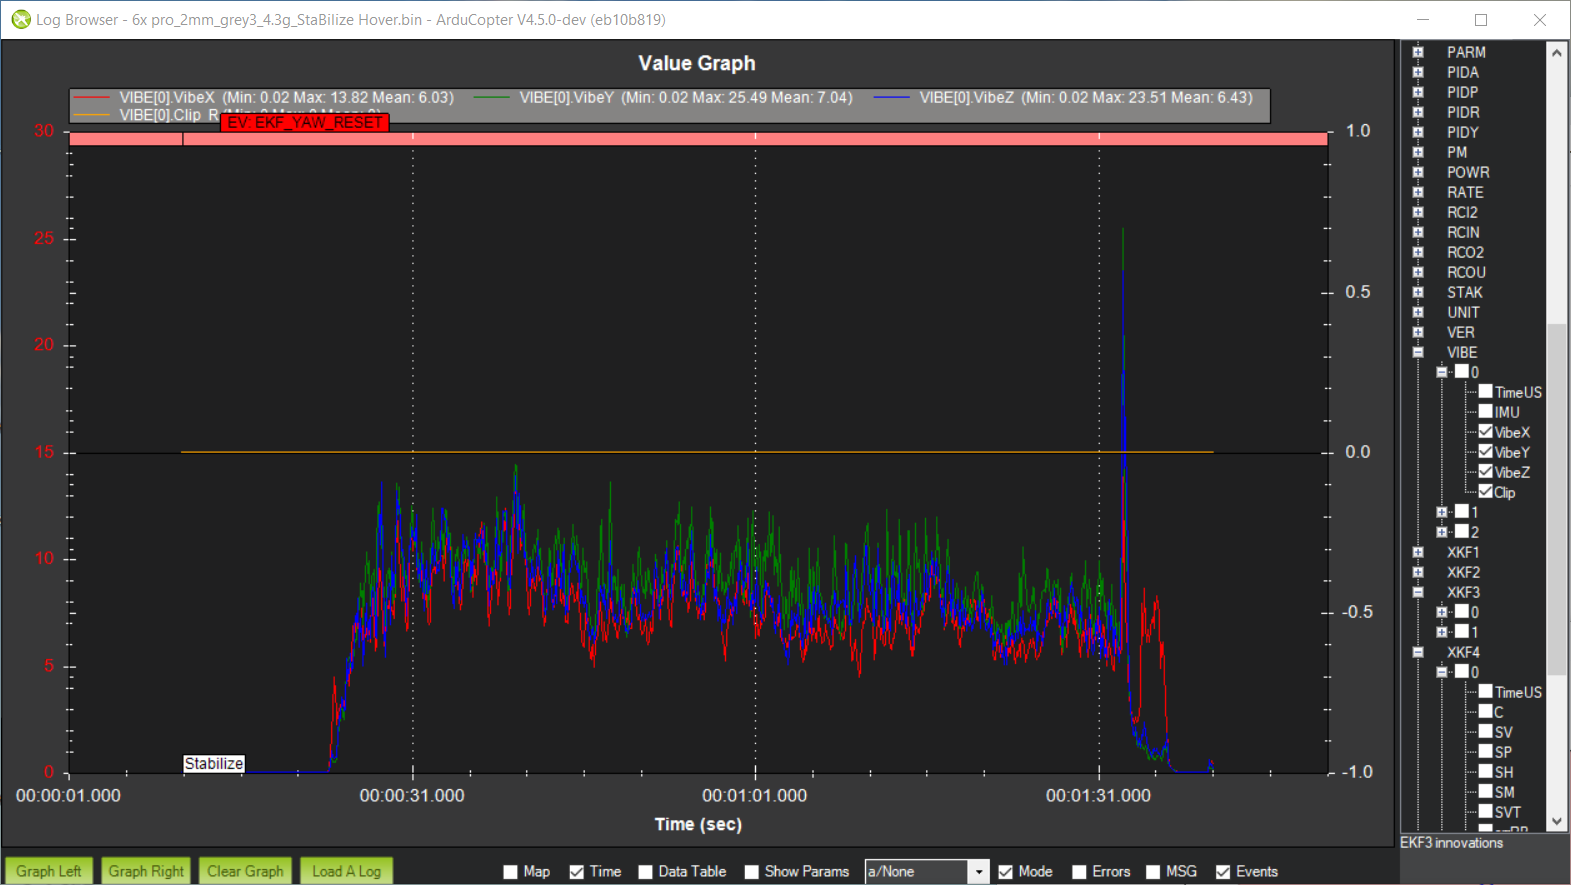
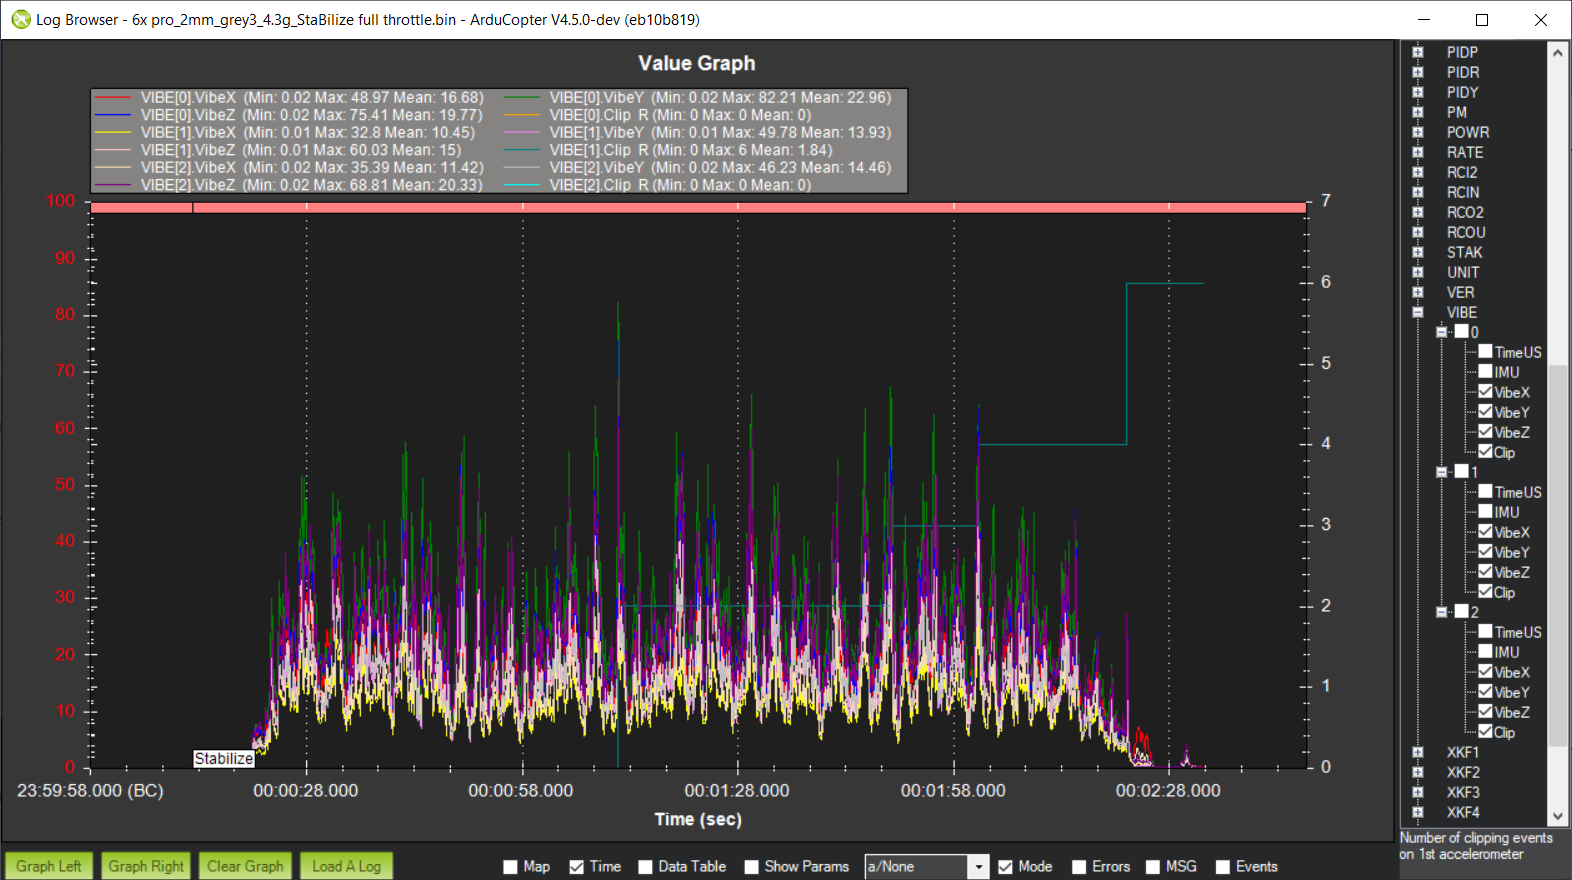
Our primary tool for looking at accelerometer affects is the VIBE log message. The elements we are looking for are low VibX/Y/Z values and zero to low clipping. Here is an example:
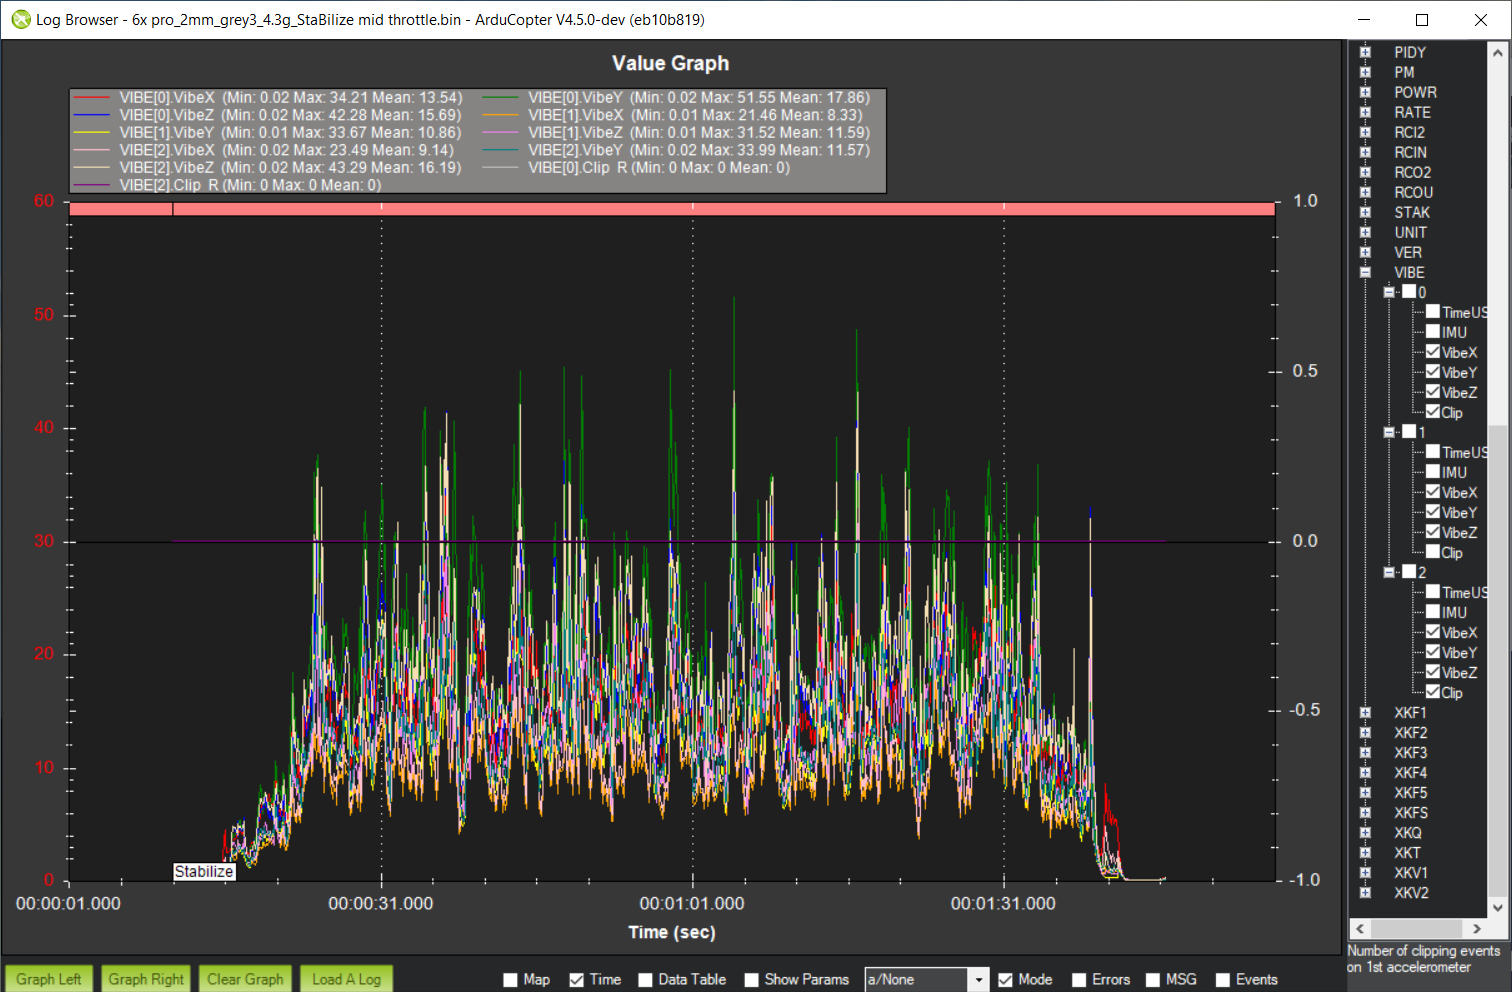
You can see that vibration is averaging around 15 and that clipping is zero. The clipping for IMU2 has been hidden in the graph because it shows two clipping events right at the end of the log - this is quite common when a copter lands quite hard as the shock of landing creates quite a high instantaneous acceleration.
Gyroscope noise and vibration
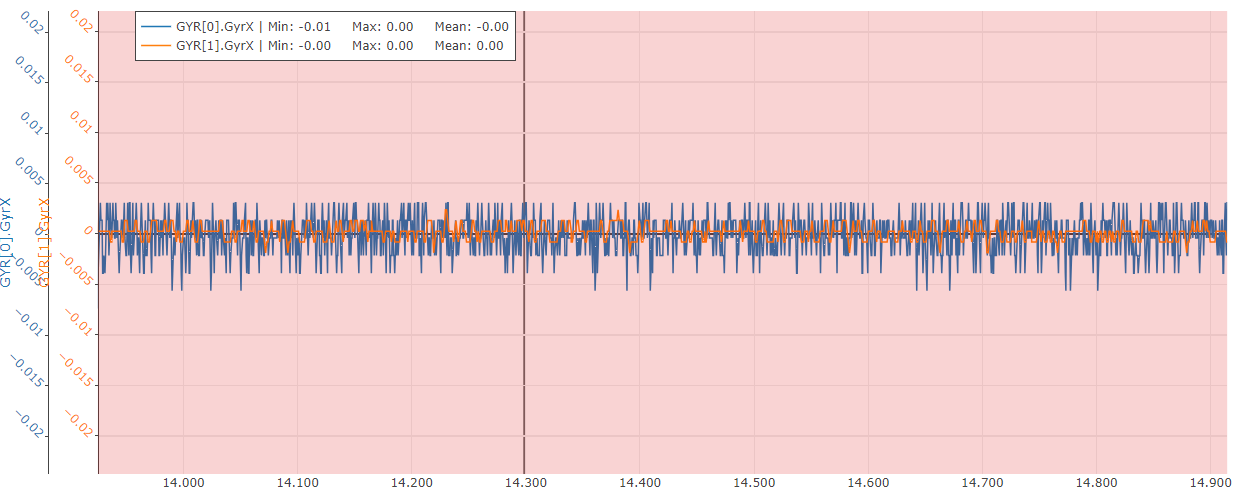
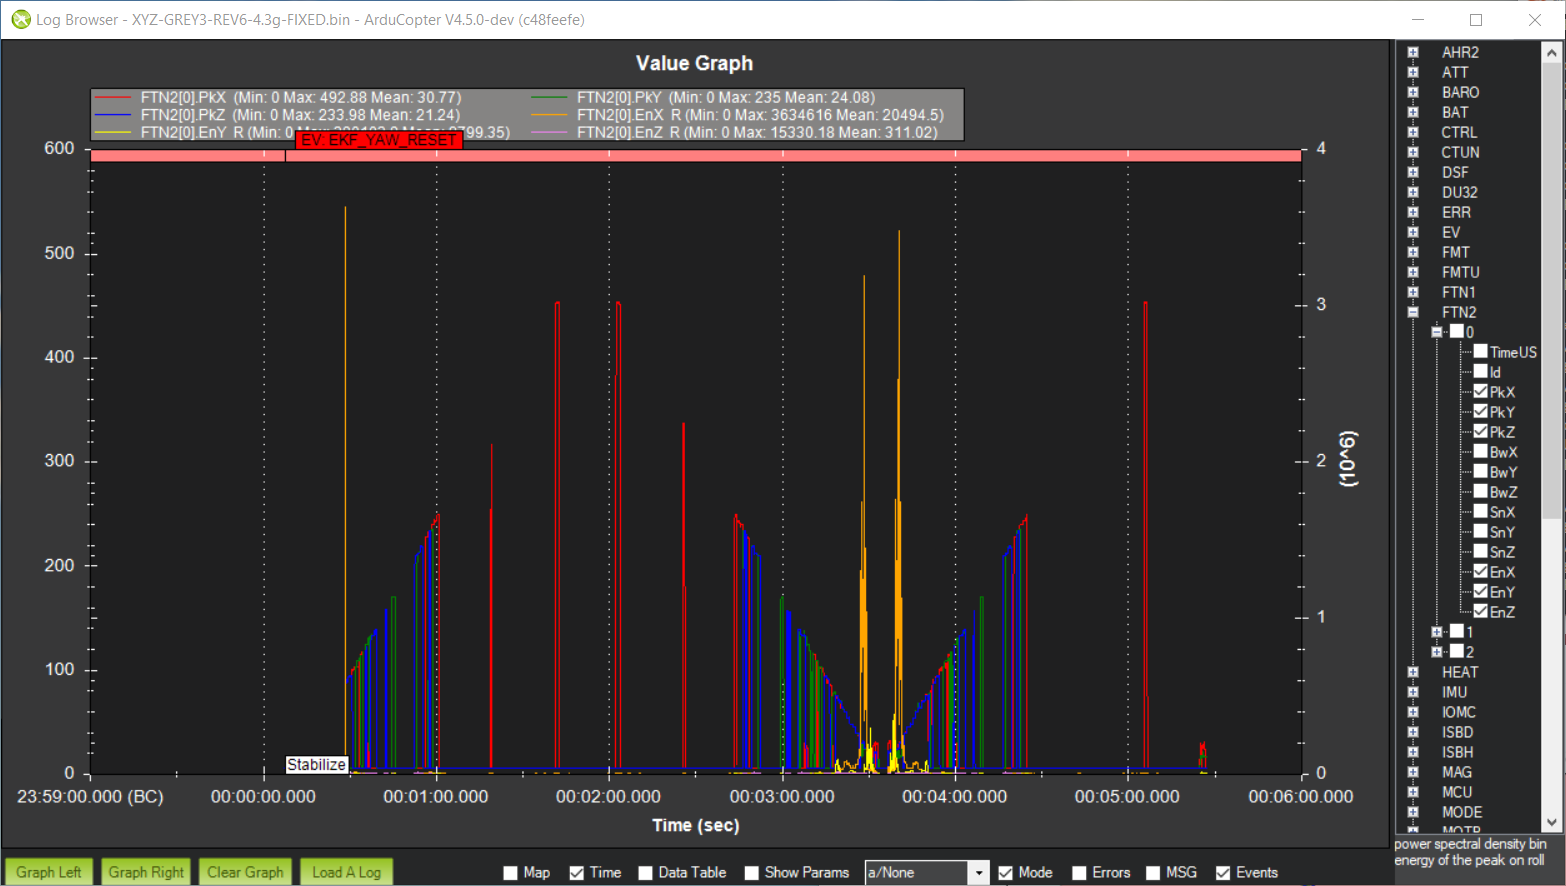
When we want to measure gyro noise the process is a little more complicated. Normally in a test flight noise is at a predefined level for a given throttle value. We can fly at this level, get a log, run an FFT and look at the results. The problem is that we want to look at the response of the physical filtering for a range of frequencies - and we don’t want to run endless FFTs to achieve this. Fortunately the in-flight FFT gives us a way out - it is able to run continuous FFTs on the changing gyro values and give us an estimate of the associated noise. What we are looking for is excess energy at specific frequencies (which will usually represent the resonance) as well as well-defined peaks - rather than a general smush - which will be easy for the software notch filters to attenuate. The elements we are looking for are contained the in the FTN2[0].PkX/Y/X and FTN2[0].EnX/Y/Z messages which represent the frequency and energy of the highest energy noise. Here is some example output:
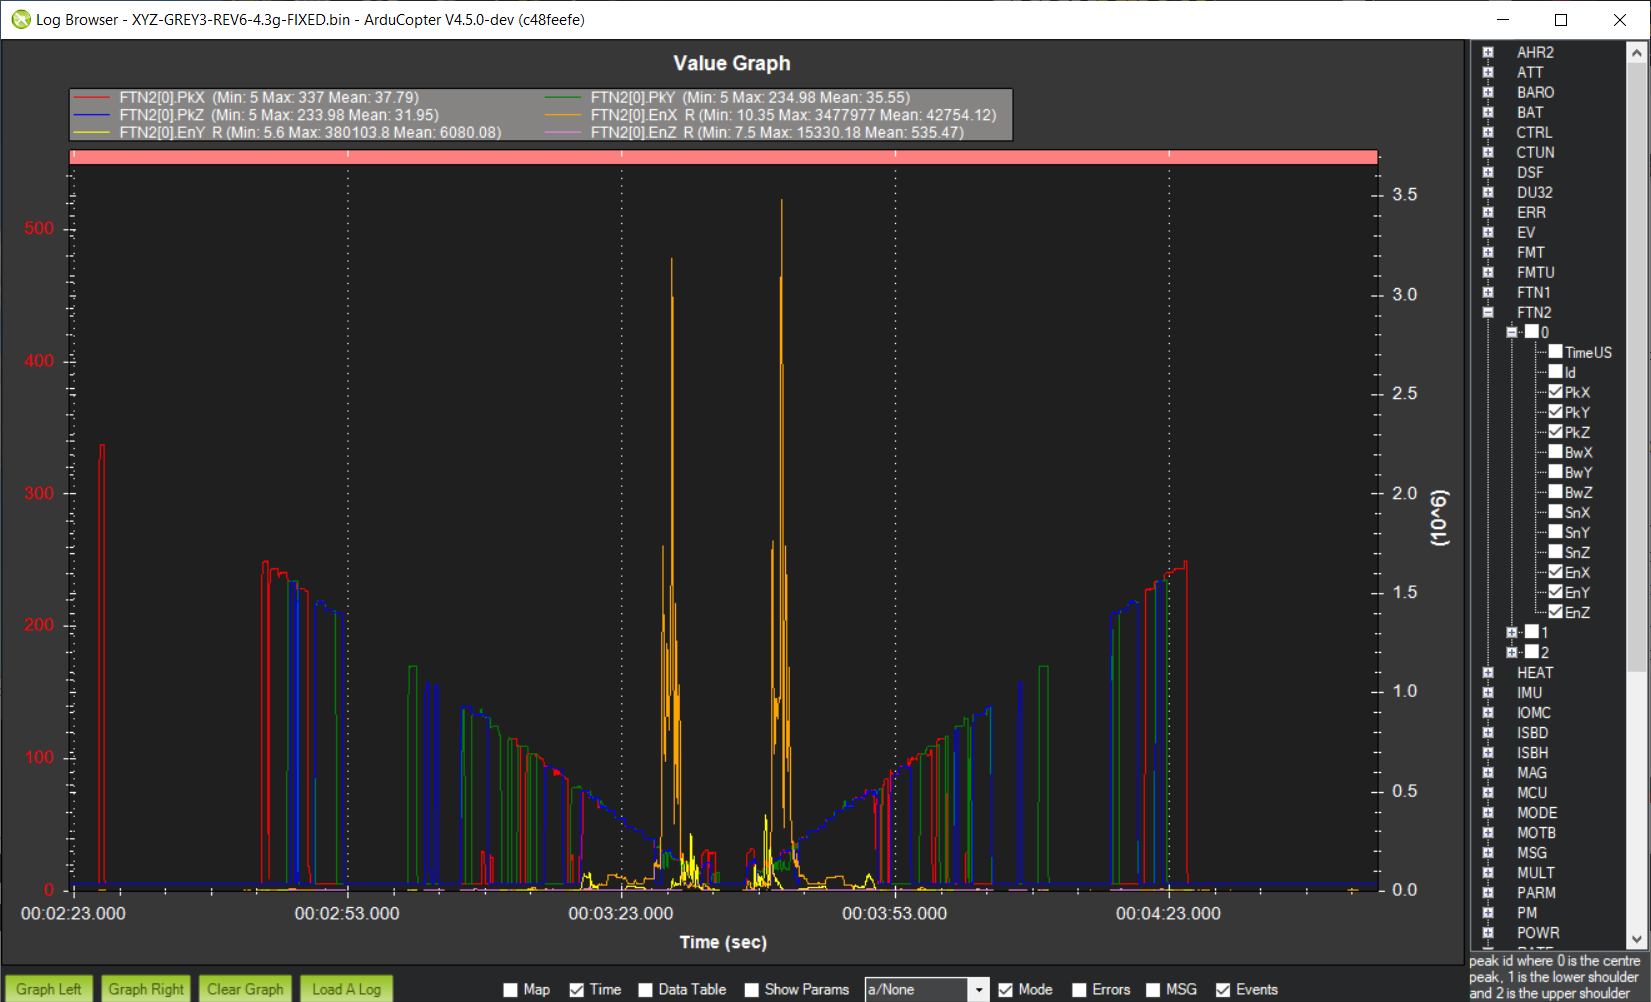
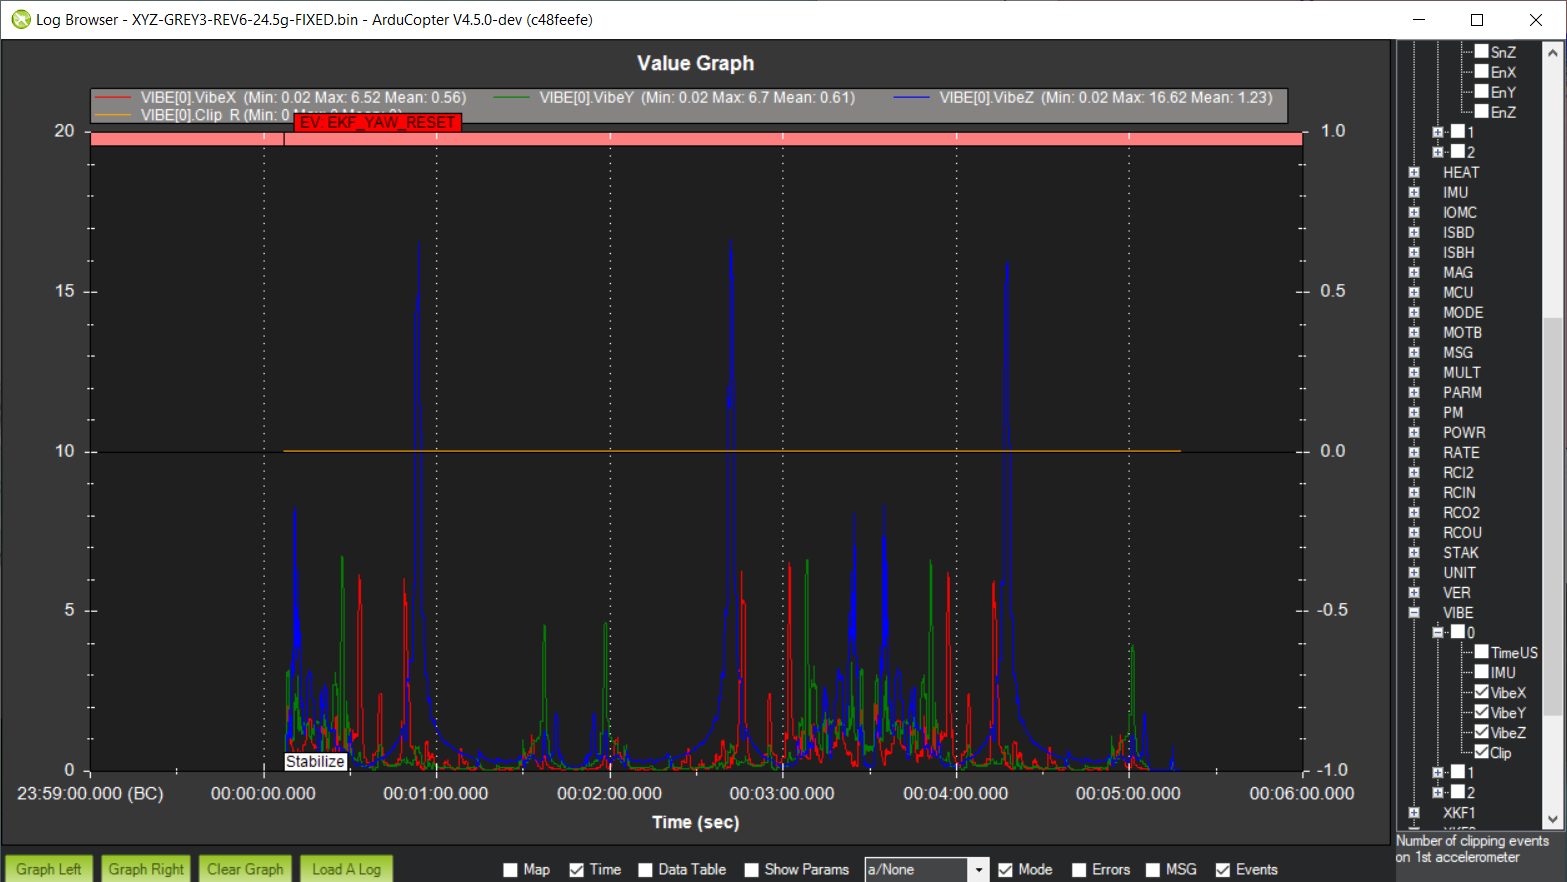
You can see in this log that there is a spike in energy at 25Hz and this represents the resonant frequency. There are also other resonances at 17Hz and 56Hz. Resonances are not necessarily bad if they can filtered effectively, so what we want is nice clean spikes rather than no spikes. The spikes are quite spread out however and the vibration is not coming through clearly - almost certainly because this is a softer silicone. Here is a different kind of stiffer silicone:
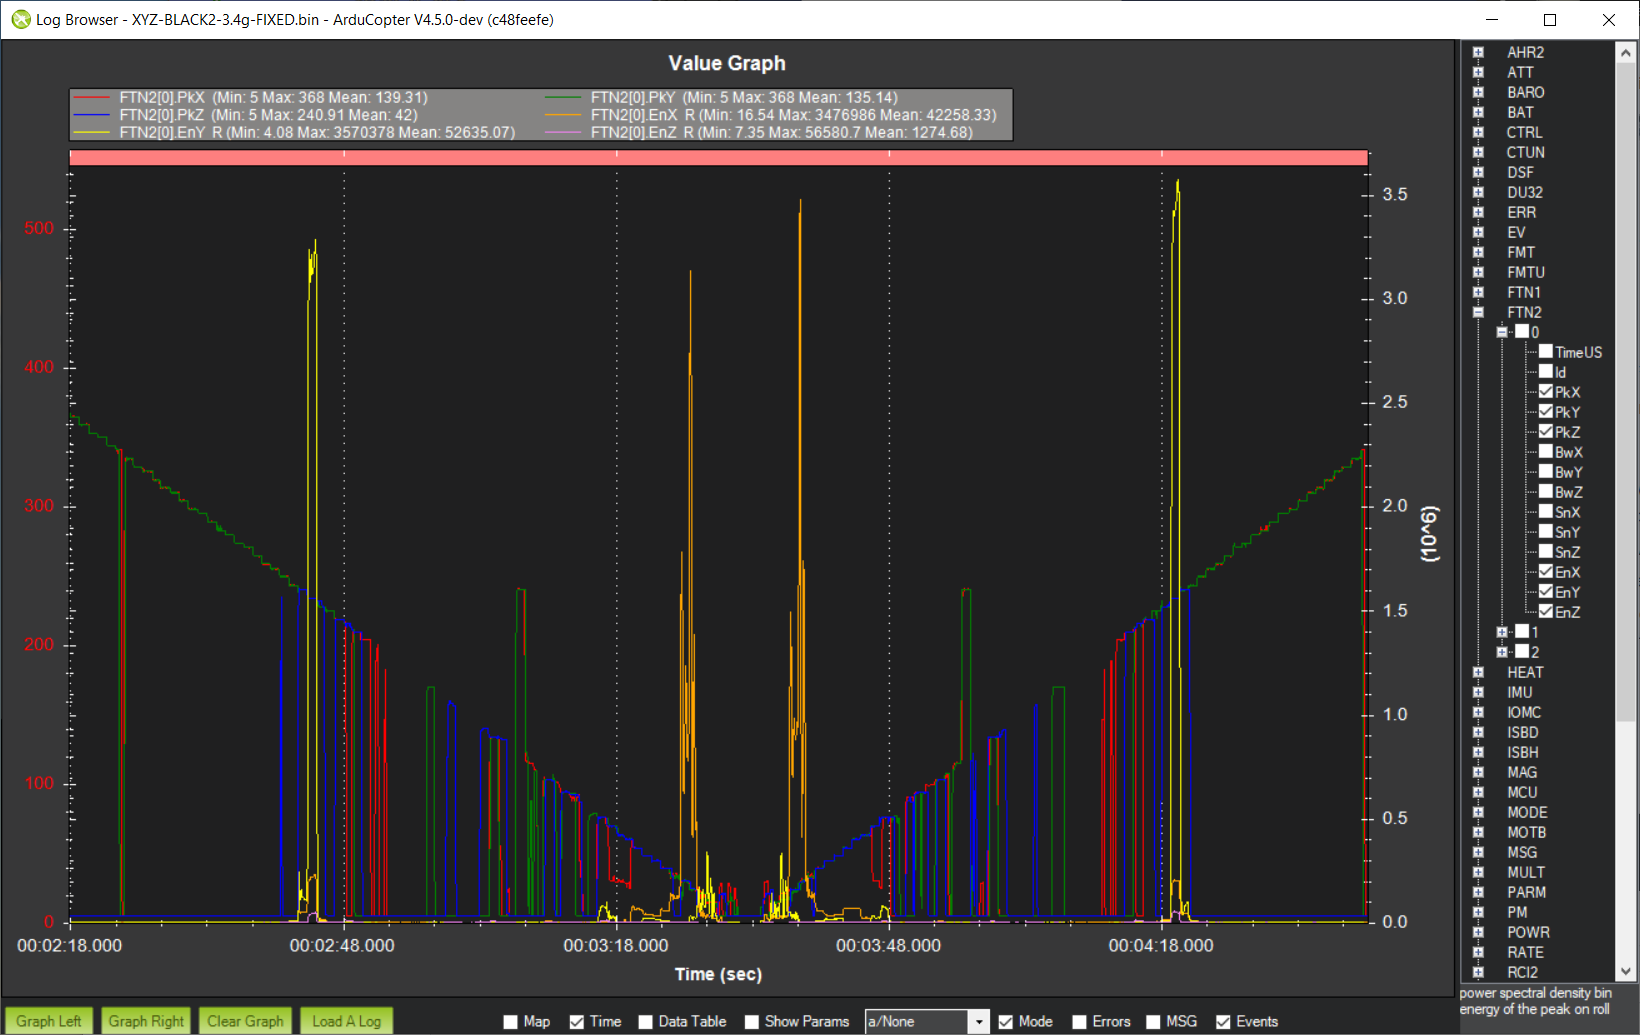
You can see that there are strong resonances at 29Hz and 234Hz, but the peaks are much cleaner. Further testing showed that the 234Hz resonance was actually a product of the vibration table itself rather than anything to do with the type of silicone being used.
Aliasing
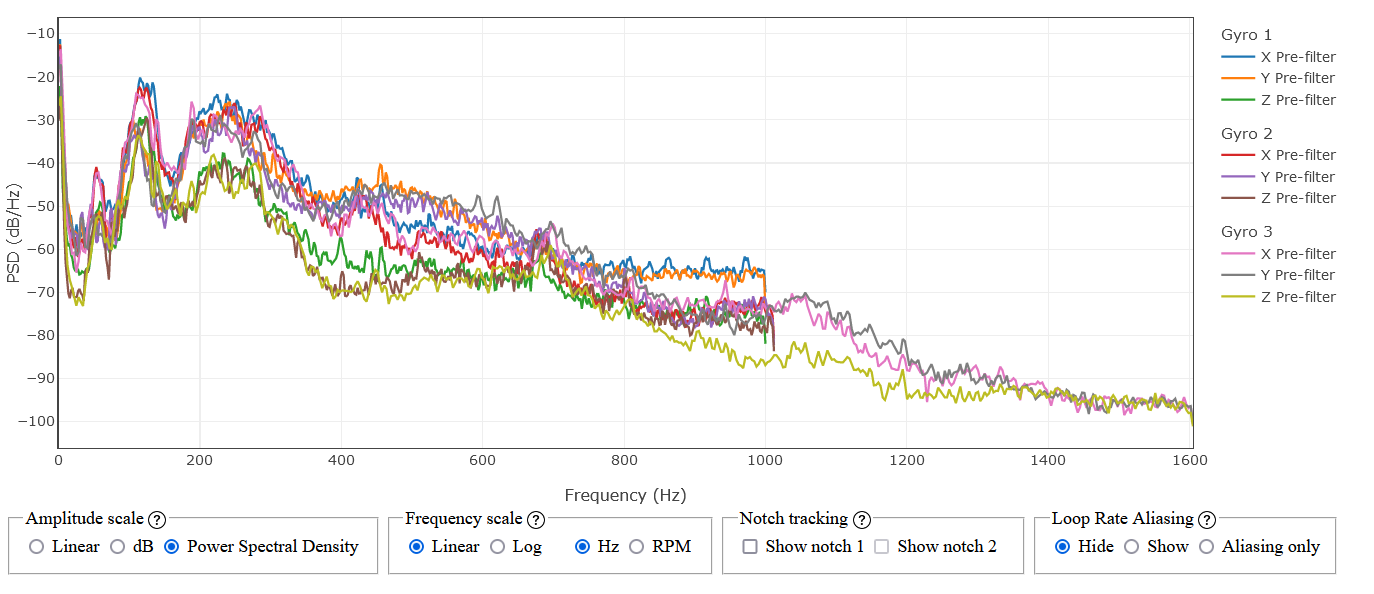
The final thing we want to check on is aliasing. Aliasing is a feature of sampling in digital filters. Any digital filter is applied to successive samples that are taken at a particular rate. For example many accels and gyros sample the sensor data at 2Khz. This means that due to Nyquist’s law the digital filters can only see noise at frequencies of 1Khz and below (1/2 of 2Khz). All well and good if there is little noise at these higher frequencies, but what happens if there is actually noise? This is where aliasing comes in - the high frequencies are folded down into lower frequencies - so 1122Hz will look like 122Hz to the filters. Fortunately, physical filtering is not subject to the vagaries of aliasing - there is no sample rate in the physical world - the sample rate is effectively infinite. Thus physical filtering is a very important tool in reducing aliasing. We can assess aliasing using the MAVExplorer.py tool which has a specific graph for showing aliasing. Here is an example:
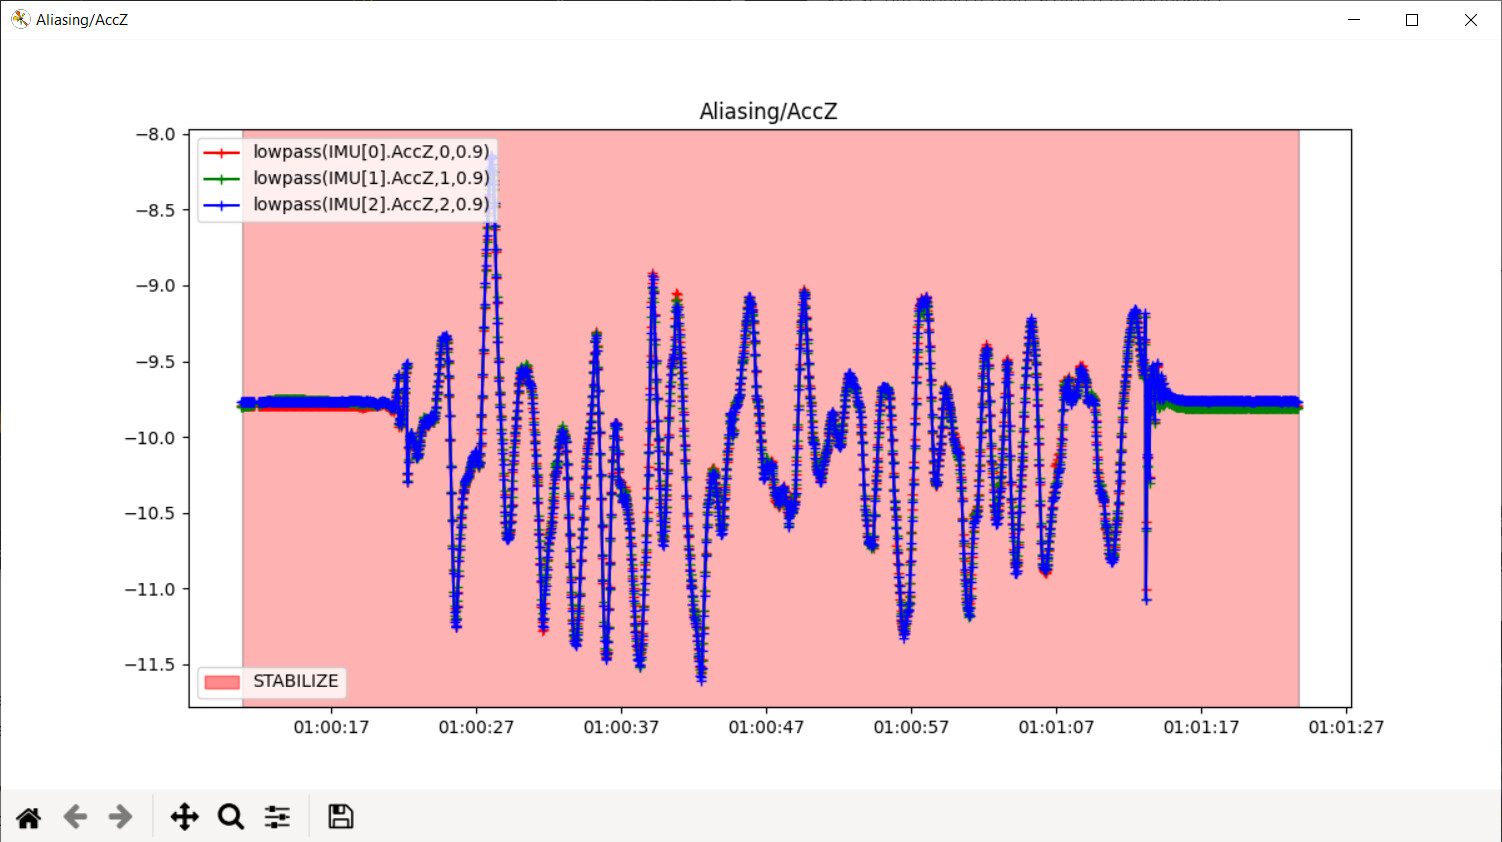
If there was sensor aliasing going on then we would expect to see a divergence in the graphs for each of the sensors.
Pixhawk 6X Pro Vibration analysis
With all these tools in our kitbag we can effectively test different physical filtering options for the Pixhawk 6X Pro. The options at our disposal are a range of weights XXXXX and a range of different types of silicon. We can run our tests against this range and assess whether there is a “best option”. In order to simplify this process for the purposes of this discussion we will simplify this to considering the lightest and heaviest weights.
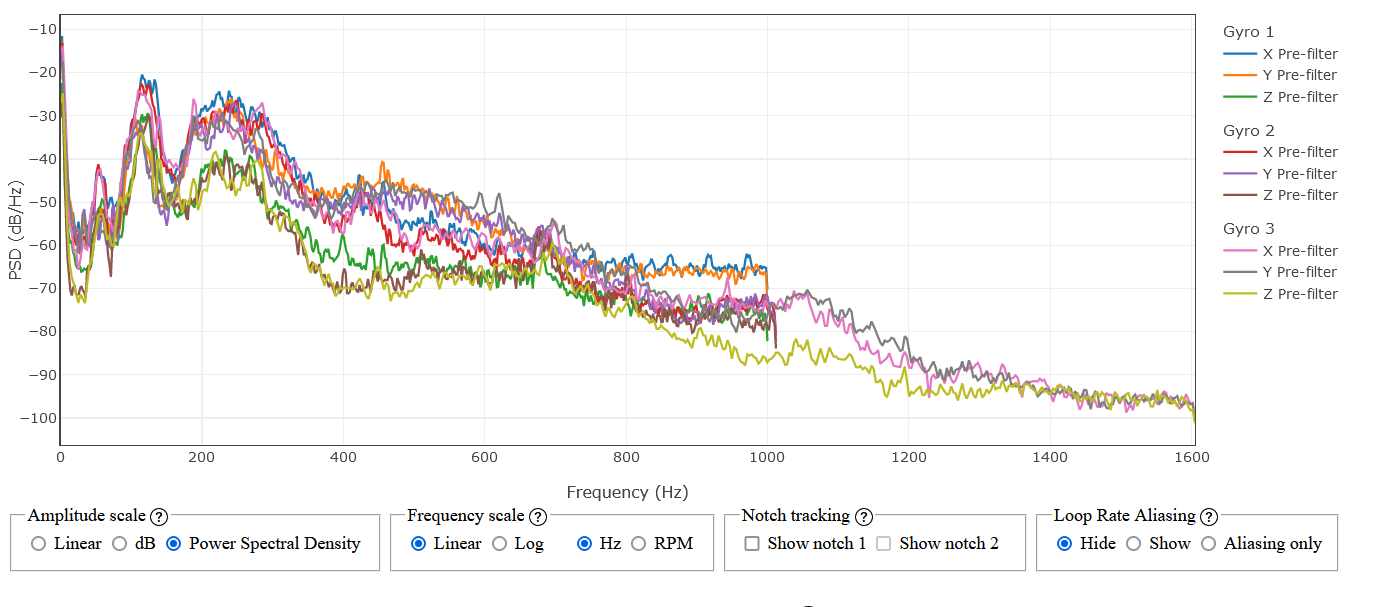
Here are the representative graphs for 4.3g weight:
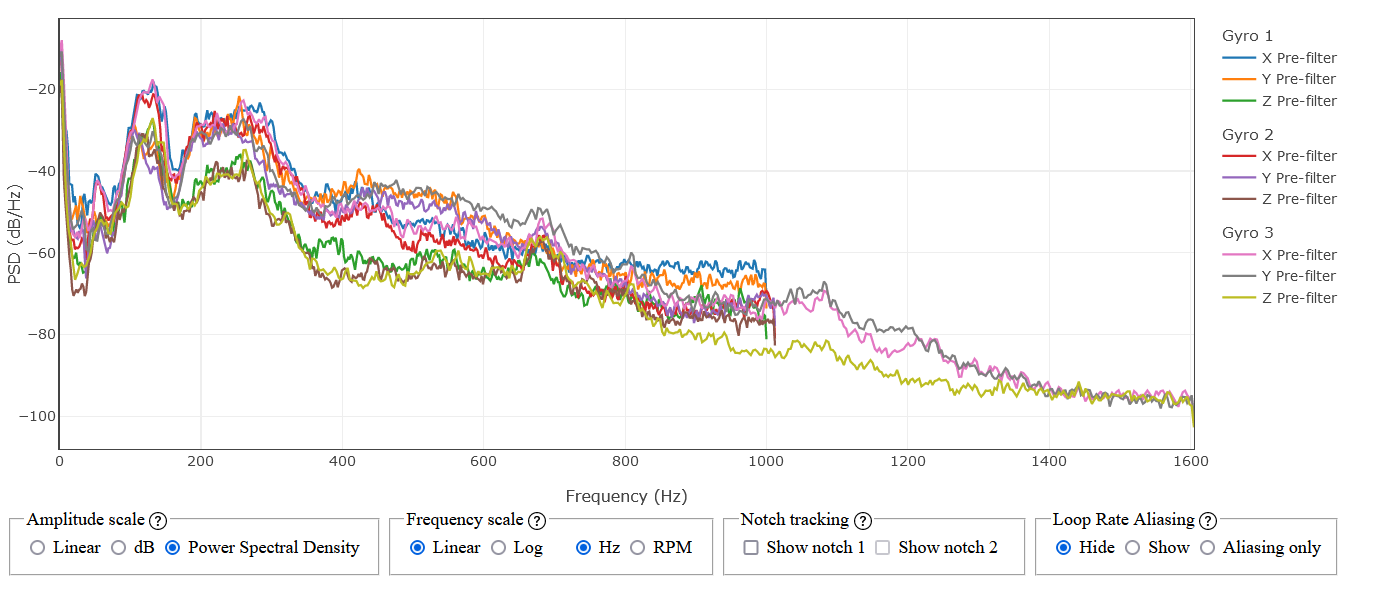
Here are the representative graphs for 24.5g weight:
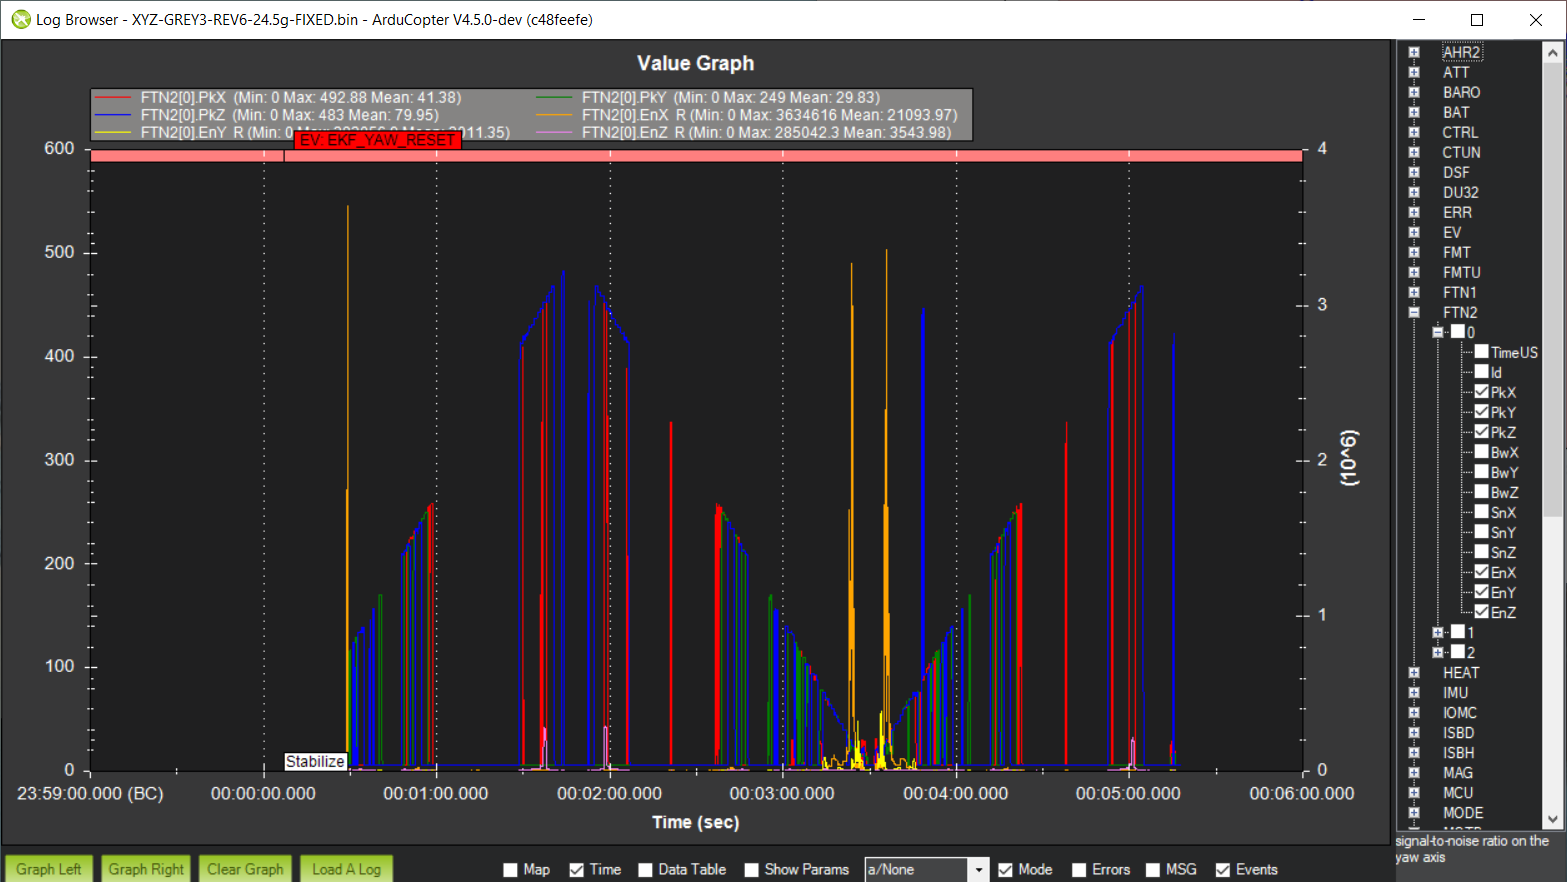
So our general conclusion is perhaps one we might expect - the use of heavier weights has a similar effect to softer silicone and results in more aggressive filtering that pushes the resonance down to lower frequencies. It also results in noise profiles that are more spread out and therefore more difficult to filter effectively. Conversely lighter weights have a broadly similar effect to more rigid silicone - it results in less aggressive filtering, but also resonances at higher frequencies that is less broad and therefore significantly easier to filter in software. The clipping and vibration seems to be largely unaffected, although some benefit is seen from heavier weights. Thus in the context of a “Pro” flight controller it is more appropriate to use lighter weights and stiffer silicone.
Final flight testing
We have a candidate for vibration isolation. The final step is to do some real-world analysis on flights using the new isolation. In order to do this we want to take a scientific approach as much as possible so that we can compare apples to apples. We want to use equipment that is representative of the kind of vehicle that might be used with such a flight controller and that might exhibit problems that the vibration isolation could help address. For that reason, larger vehicles - which tend to have more complex noise profiles and lower frequency vibration - are more representative.
In light of this a 650mm class vehicle was used for the testing.
In terms of the actual test we want to fly a standard pattern at different throttle levels (since noise is directly correlated with the output of the motors and hence the input throttle). Thus a box pattern at hover, mid and full throttle was flown in both stabilize and loiter and the logs recorded. Let’s have a look at the logs:
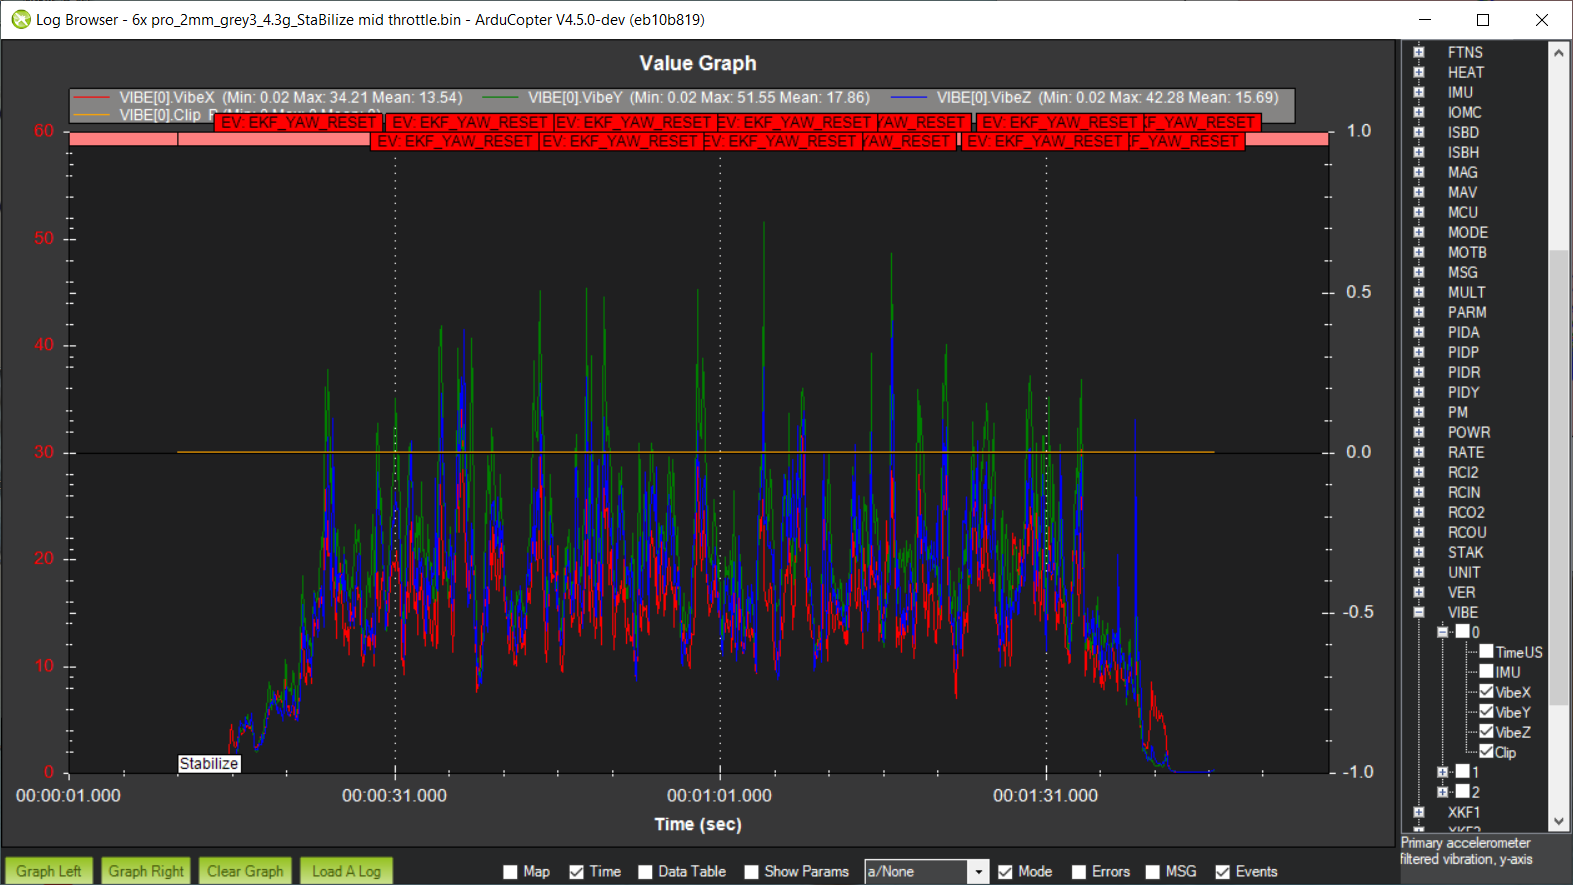
It is apparent that as the throttle is increased the acceleration vibration increases, but the gyro noise is somewhat constant. Also in the full throttle log you can observe some clipping on the second IMU. This is down to the sensor limits. The high quality sensor being used for IMU1 has 40g limits and IMU3 has 32g limits, but IMU2 only has 16g limits - hence why clipping is observed.
So it seems the new vibration isolation is working well and allows effective software filtering and thus flying.
Conclusion
In this blog we have looked at the various causes of flight instability and how these can be mitigated through physical and software filtering. We then looked at the new Pixhawk 6X Pro and its novel approach to vibration isolation. We then examined the different ways that we can analyse the effectiveness of vibration isolation and applied these techniques to evaluating different variants of isolation for the Pixhawk 6X Pro. Finally we did some flight testing and evaluated the results.
Happy Flying!
(As a bonus, here is a video review I did of the mounting and how you can change it)