Hello,
this is my first post, I don’t know if I’m asking in the right place, if I chose wrong I apologize ![]()
I have a question, I have a .bin file from a flight, I convert to *.*mat in ArduCopter V4.3.7 on linux Ubuntu 22. I process the data to and send to Python3. I don’t have Maltab only free Octave hence to intentionally work with Pytohn. In Pandas I get results and graphs from the flight but I have a problem:
Time = f(acceleration):
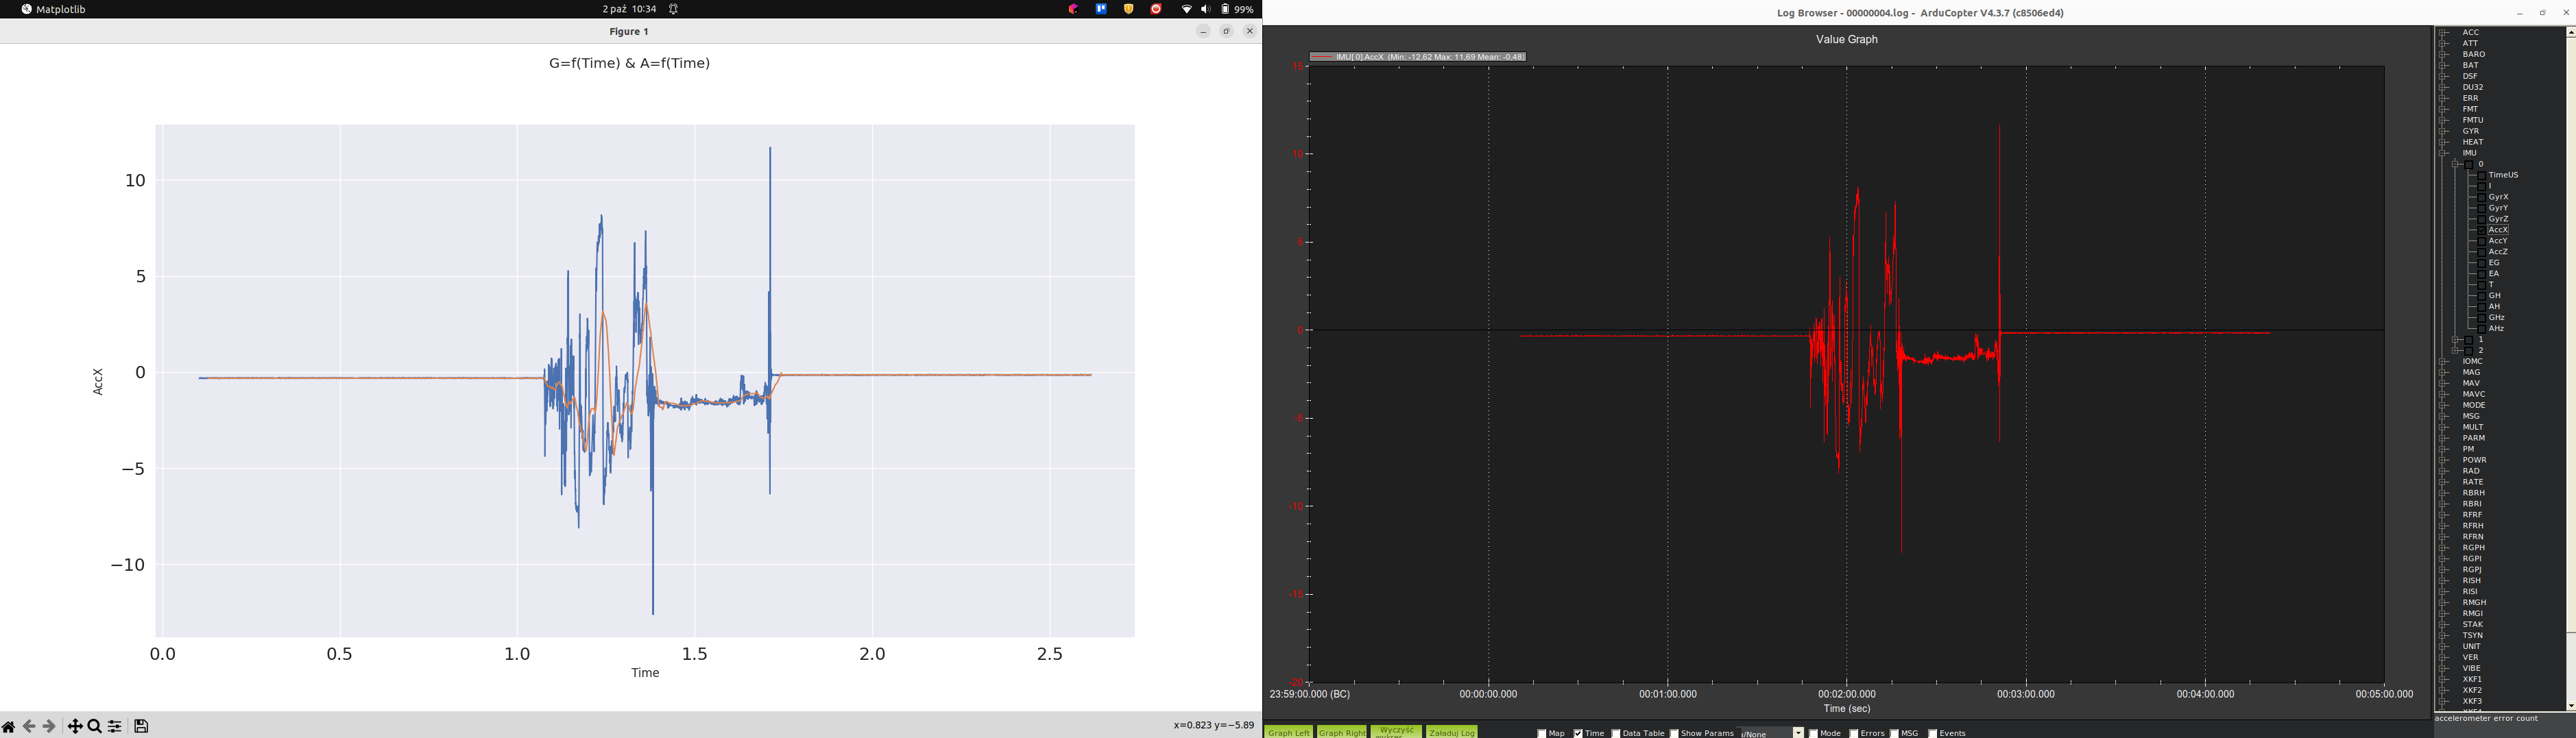
Graph in Ardu - acceleration axis -10 to 10, time axis from 0 sec to 5 sec and it’s ok,
In Octave I read the acceleration axis the same value, time 0 to about 2.5 sec
Graph in Python as in Octave: acceleration -10 to 10, time from 0 to about 2.5 sec - but the graph is identical to that in Adru. I completely don’t understand this, why I have the time in Python 2x smaller on the x-axis, while the graph is the same,
Can I ask for help in solving this problem.
Thank you very much in advance.
Regards,
![]()