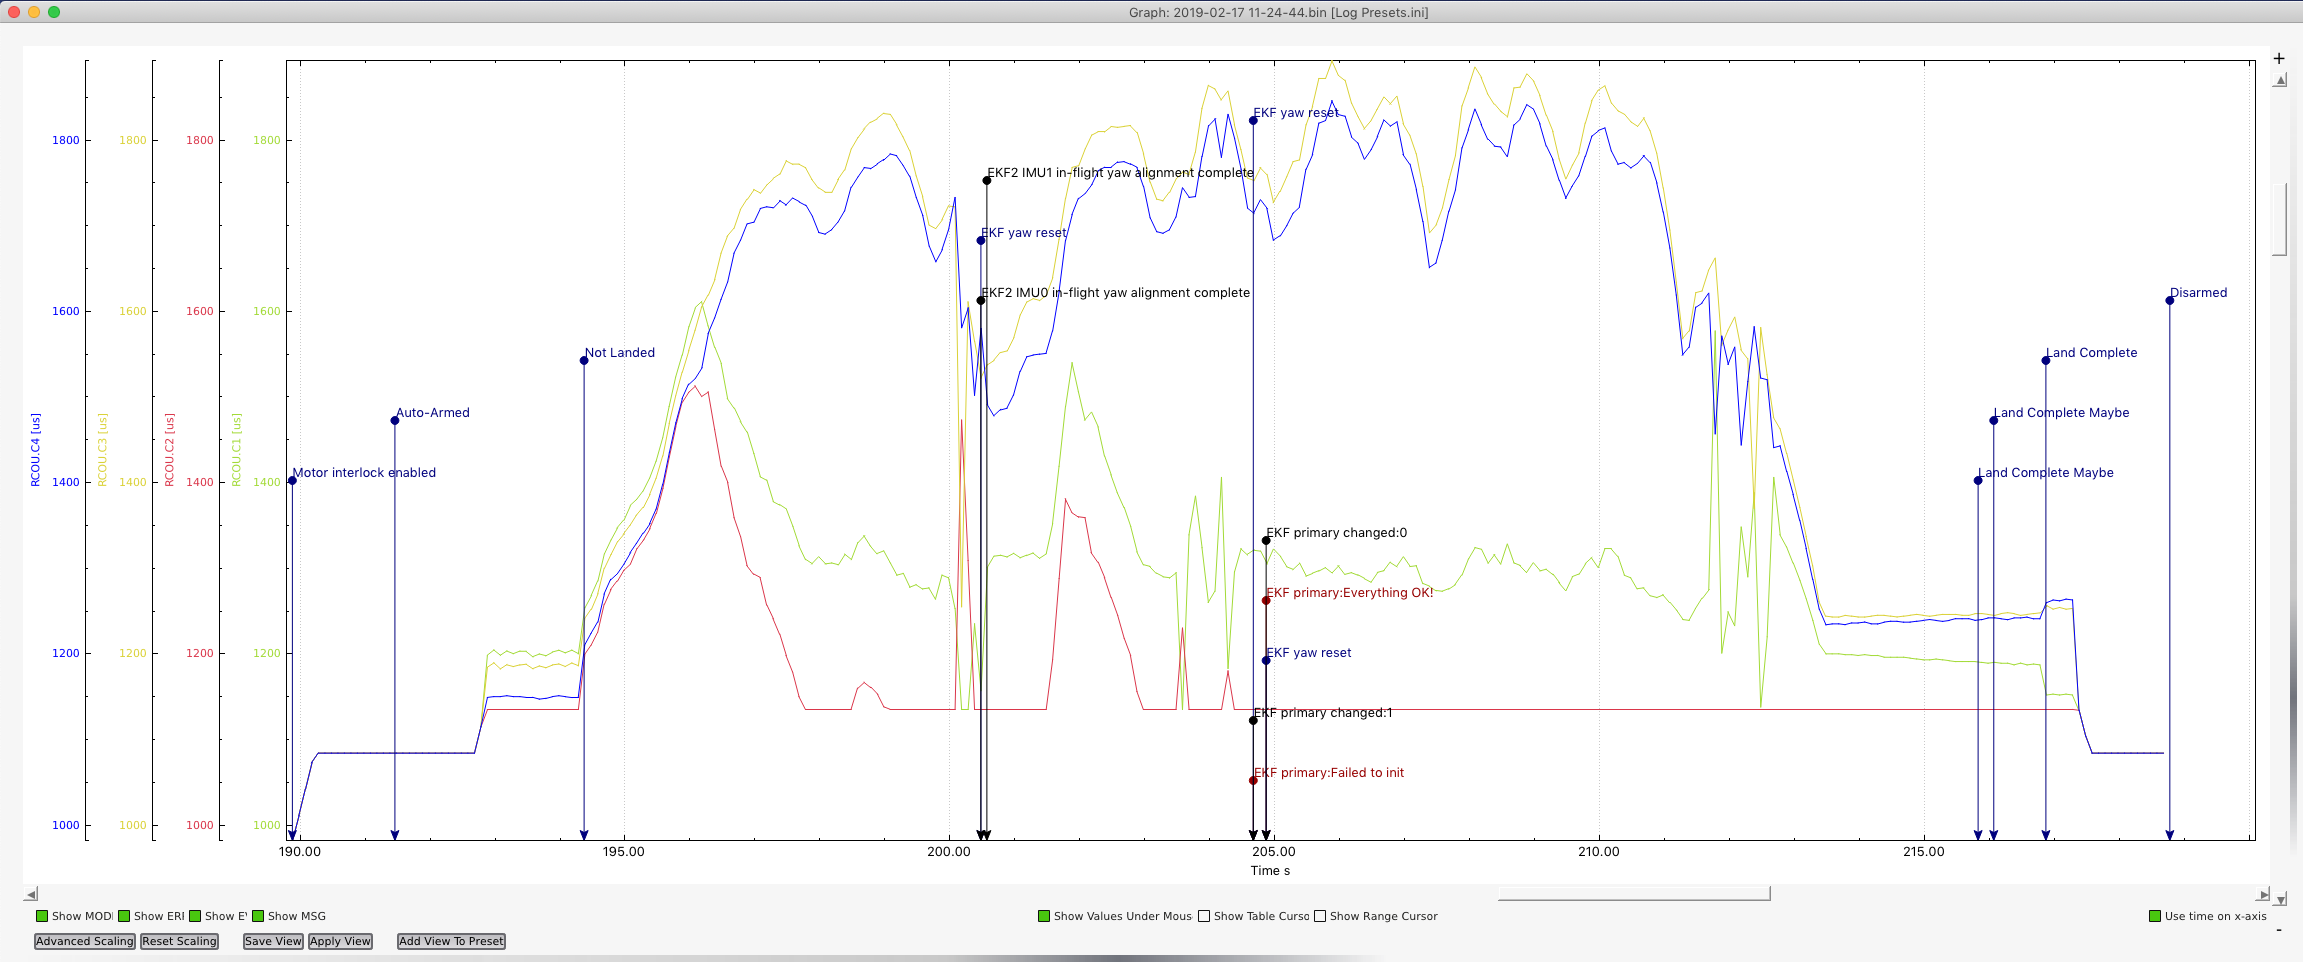
Hello, I am trying to create graphs to help understand the quad. What software can I use to recreate a graph that looks like this? I’m most interested in the timeline of events like armed, interlock enabled, error messages. Thank you
APM Planner2 does those graphs and it’s pretty useful.
Dronee Plotter is quick/easy and online so there’s nothing to install.
MissionPlanner does graphs too but I find they tsnd to get crowded and harder to read.
1 Like
…Got it. Thank you!
Hi, though I am using APM Planner too, note that some of the new features of AP, like CANBUS ESCs by id can not be seen in APM Planner.
Gal