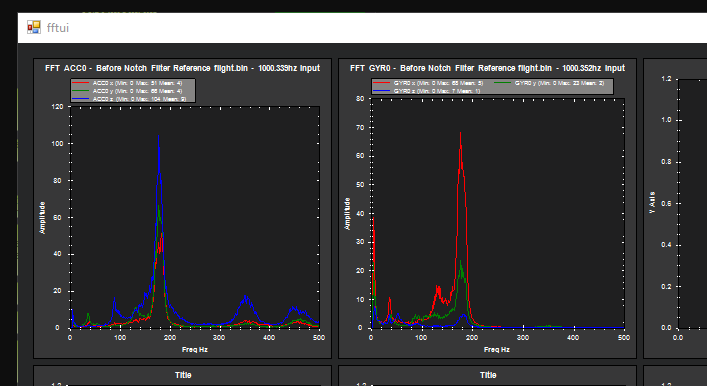
Hi, don’t know what I did wrong but trying to tune a copter I go into Harmonic Notch Filtering process and got resulting FFT graphs displaying only with negative amplitude values:
Is it normal ?
Thanks
Hi, don’t know what I did wrong but trying to tune a copter I go into Harmonic Notch Filtering process and got resulting FFT graphs displaying only with negative amplitude values:
Yes, it is normal and very desired. The measure is a noise to signal ratio.
Positive values would mean more nose than Signal. Nobody wants that.
For more information search this forum. This question has been answered before.
Thanks or your reply. I will try to find it. The example is the documentation (Measuring Vibration with IMU Batch Sampler — Copter documentation) shows positive values:
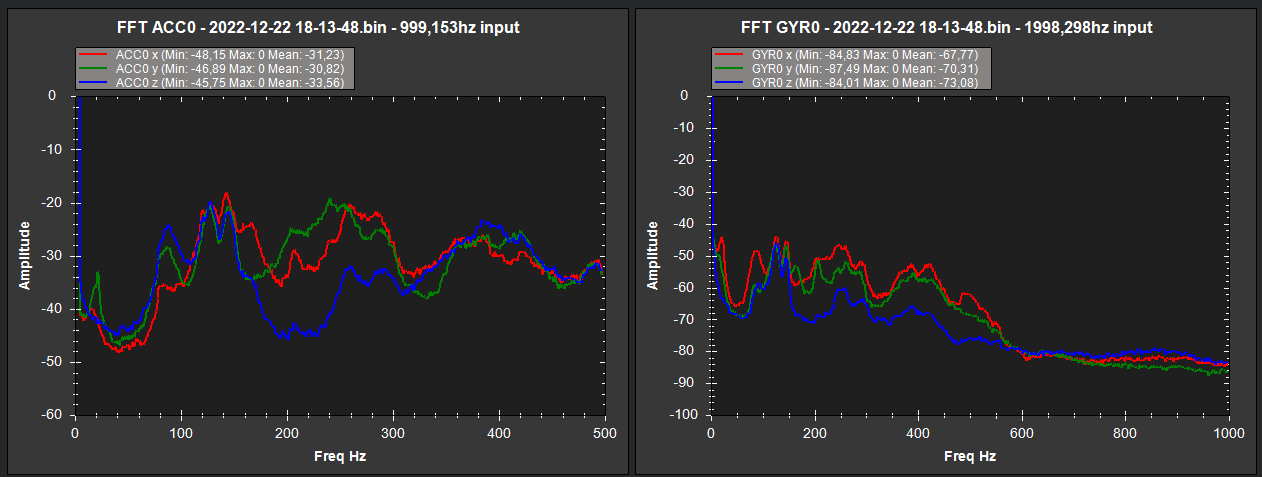
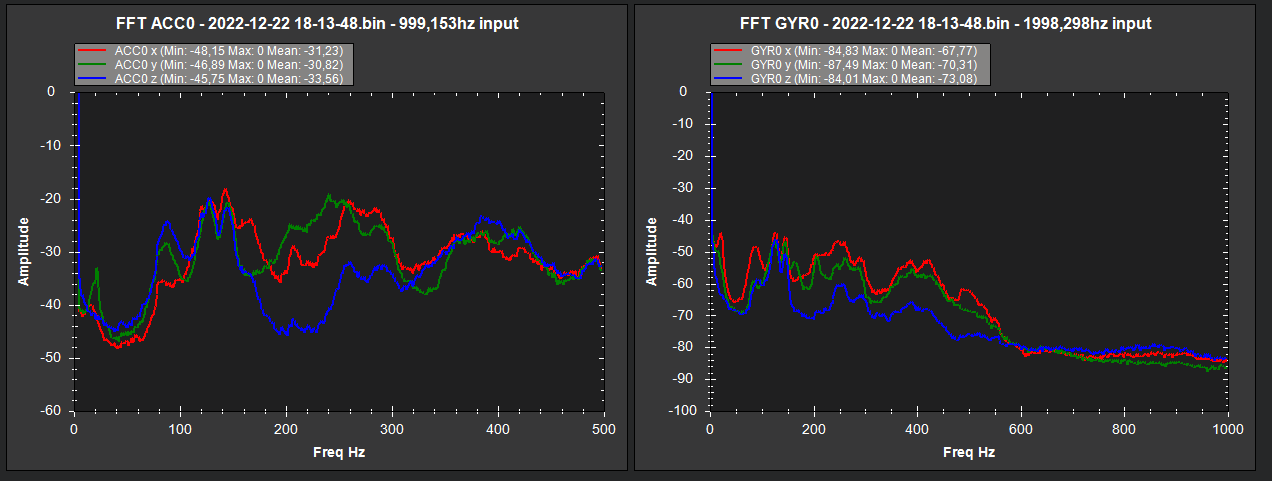
Those (old) Y axis are linear. The (new) ones you have use a logarithmic Y axis.
Control theory literature uses logarithmic Y axis, so ArduPilot changed it to be consistent with the rest of the world.
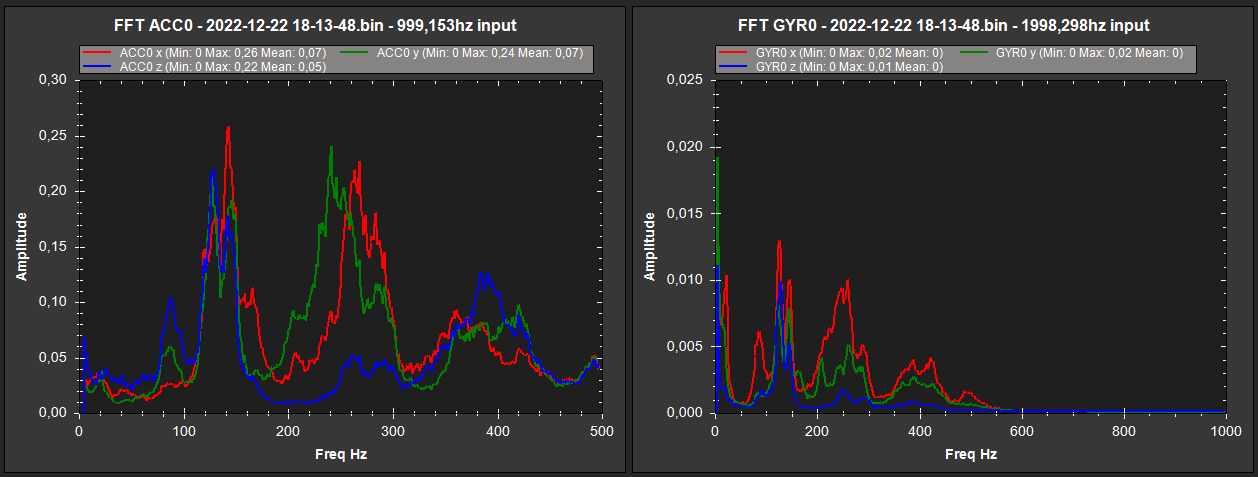
And there is still the option to use the old Y scaling, if you tick the “magnitude” checkbox.
See the small Magnitude checkbox on the FFT screen in the lower left? Check it before loading a file for a scale (linear) that is actually useful. For FFT analysis to configure the notch filter I don’t find log scale at all useful. Perhaps if the peaks were an order of magnitude or 2 from the baseline it would be.
Thanks all for your help. I agree with @dkemxr that linear scale is easier to use to identify resonating frequencies, at least in my case.
log scale: