Impotant note : The hardware comparison here is done based on what was in my hand at the time of testing. It has to be noted that although Here4 has L5 band capabilities (in addition to L1) enabled at the time of testing, the base antenna was only capable of receiving L1/L2 channels. That may not be the case to consider for some who are reading this post and is not any indication of a bias towards any hardware manufacturers. I will soon be doing another round of review with the base antenna capable of L5 receiving channels side by side such that the comparison would be fair.
Introduction
I got my hands on the Cubepilot Here4 and the Holybro DroneCAN H-RTKF9P Rover. I was curious to know the difference in performance between them, so over a cup of coffee and a 12-hour test session repeatedly, I set out to see how these two compare in the real world.
NEO vs. ZED F9P Module
While they are both using ublox F9P, they are actually using two different F9P models from ublox. The Holybro H-RTK has the ublox ZED-F9P inside, while the Here4 has the ublox NEO-F9P.
Setup
Both of the GPS receivers are connected to the same flight controller (Pixhawk 6X) and powered by the same source, all set to RTK mode. The base station I used is the Holybro H-RTK F9P Base with Harxon antenna, and the antenna is mounted about 1.5 meters above the ground.
How are the results calculated?
This calculation method is inspired by this post by Andrew Tridgell. Big GPS Round Up
- Calculate Mean Position: Determine the average latitude, longitude, and altitude.
- Compute Errors:
- Horizontal Error: Measure the distance from each point to the mean position
- Altitude Error: Calculate the difference between each point’s altitude and the mean altitude
- Calculate Percentiles for Error Distributions:
- CEP (Circular Error Probable): Determine the 63.2nd (CEP50) and 98.6th (CEP99) percentiles of horizontal errors as approximations. (In here I have assumed that the data is following Rayleigh’s distribution)
- Altitude HEP (Height Error Probable): Calculate the 50th (HEP50) and 99th (HEP99) percentiles for altitude errors.
A Quick GPS Rundown
Before we dive into the nitty-gritty, let’s talk about GPS. It’s not just about ‘finding you’ – it’s about how precisely it can do it. We’re talking about a bunch of satellites zipping around Earth, sending signals to your little module. The catch? Things like how many satellites it can see and what’s blocking those signals can make a big difference.
There are couple of notes here to consider:
1- QGroundControl has a setting for how to acquire RTK fix either using surveying by a fixed antenna connected to it or using NTRIP server data.
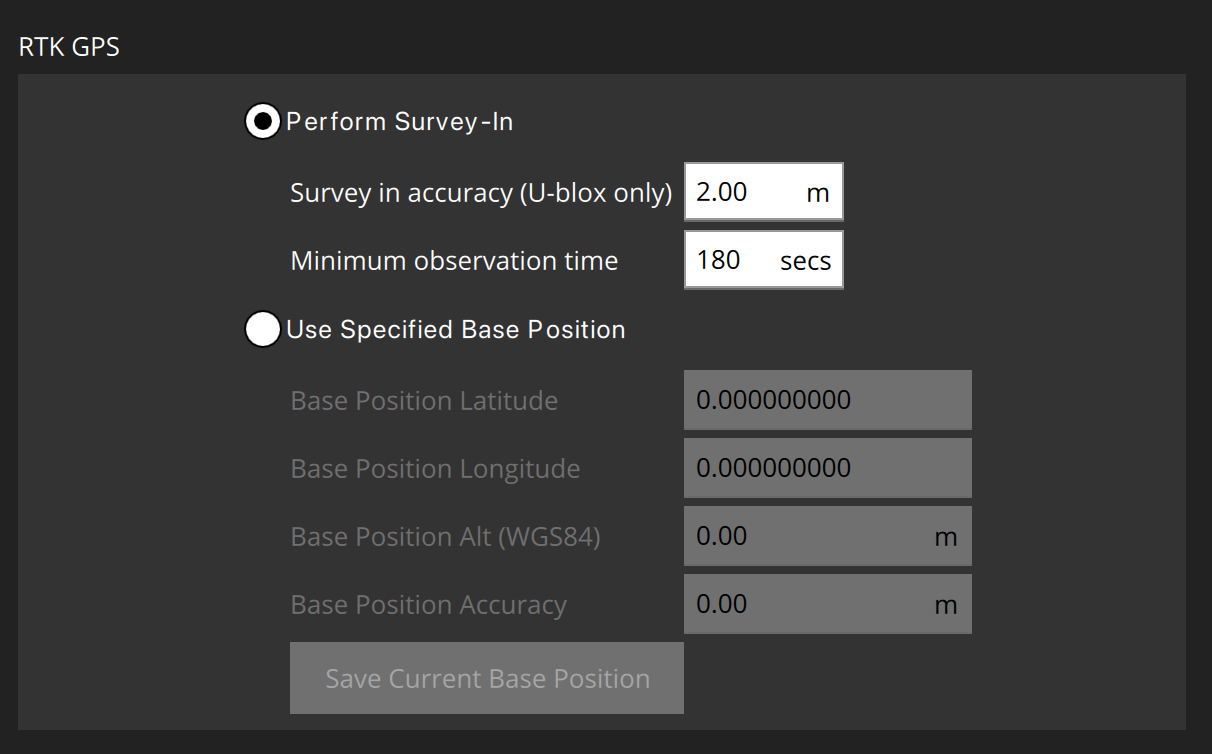
This is how I did my setup with QGC.
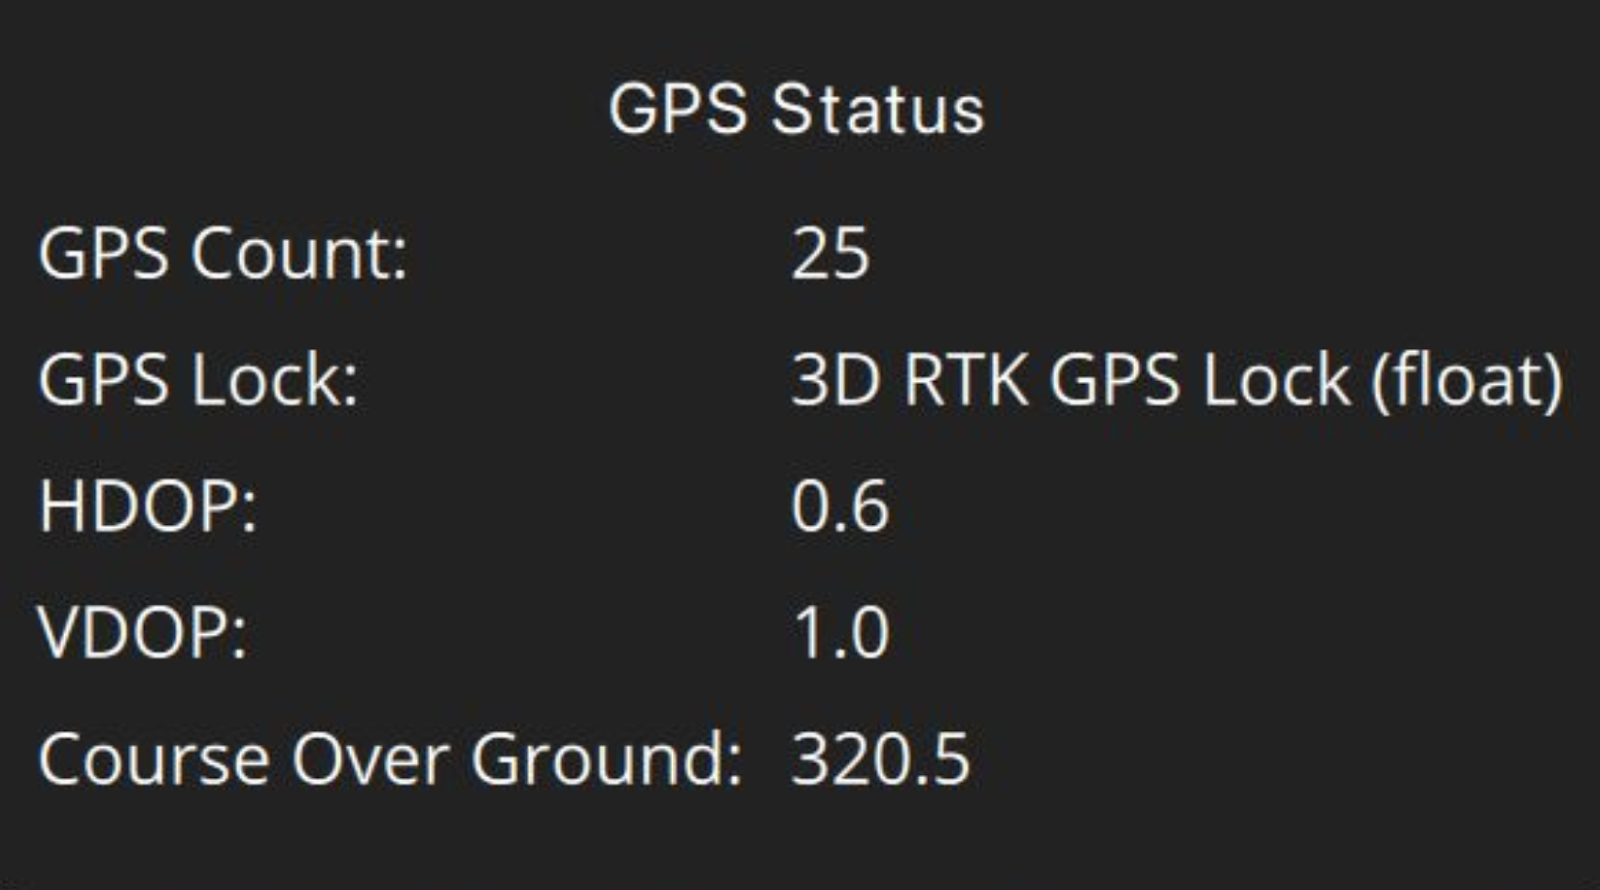
2- I have started logging the data when the GPS FIX is set to RTK, as you could see
The First one: As occluded as possible
Our contenders, the Cubepilot Here4 and the Holybro DroneCAN H-RTK F9P, were hooked up to a Pixhawk 6X, all set to RTK mode. RTK’s like the GPS’s secret sauce – it uses a fixed base station to make the position data from satellites super precise. And with QGroundControl feeding RTCM data for timestamp corrections, we were all set for some serious GPS action. I used PX4-Autopilot firmware v1.14 for all the tests.
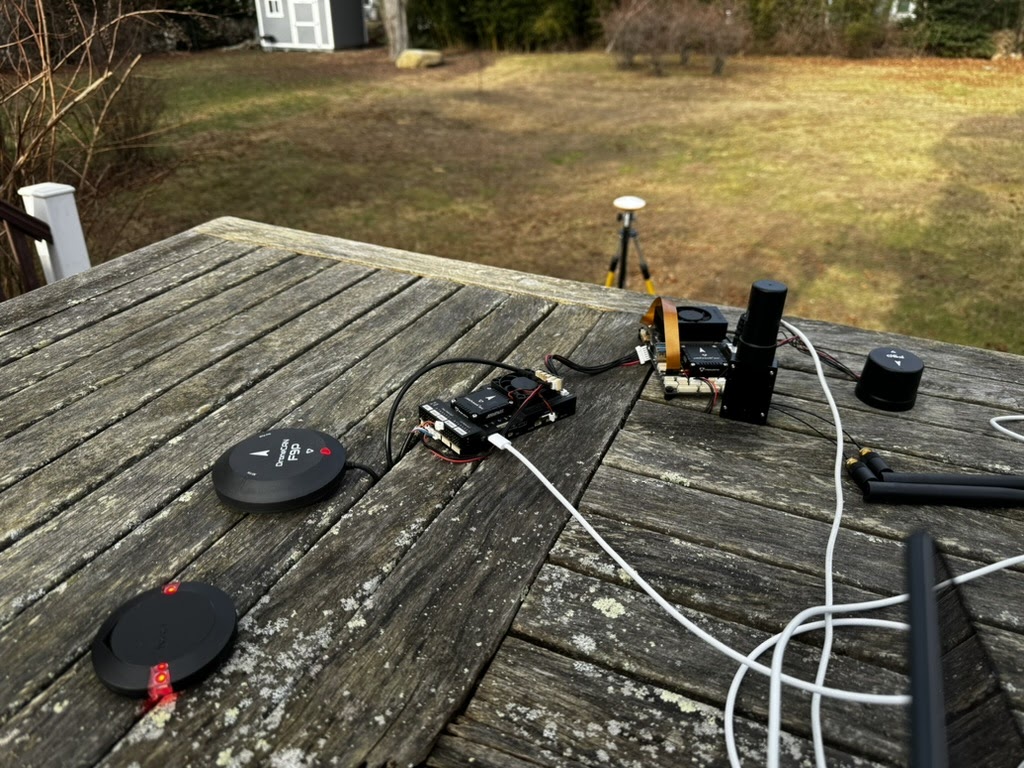
As the below photo shows, I have put both GPS devices outside my room window and the Holybro H-RTK Base Station RTK antenna a bit further apart, such that it has barely any open sides and only the sky is accessible to some extent. It was also a cloudy day, so this was a harsh environment for GPS.
The Showdown: CEP and HEP
We’re measuring two things here: CEP (Circular Error Probable) for how spot-on the module is horizontally, and HEP (Height Error Probable) for the vertical oomph. Think of CEP like a dart game – how close can you get to the bullseye, and HEP is like measuring how well you can hit the same floor tile every time you jump. The calculations to give you an idea have already been mentioned.
Round-by-Round Results
Let’s roll out the numbers:
| Metric | Cubepilot Here4 (Meters)(Float fix type) | Holybro DroneCAN H-RTK F9P (Meters) (Float fix type) |
|---|---|---|
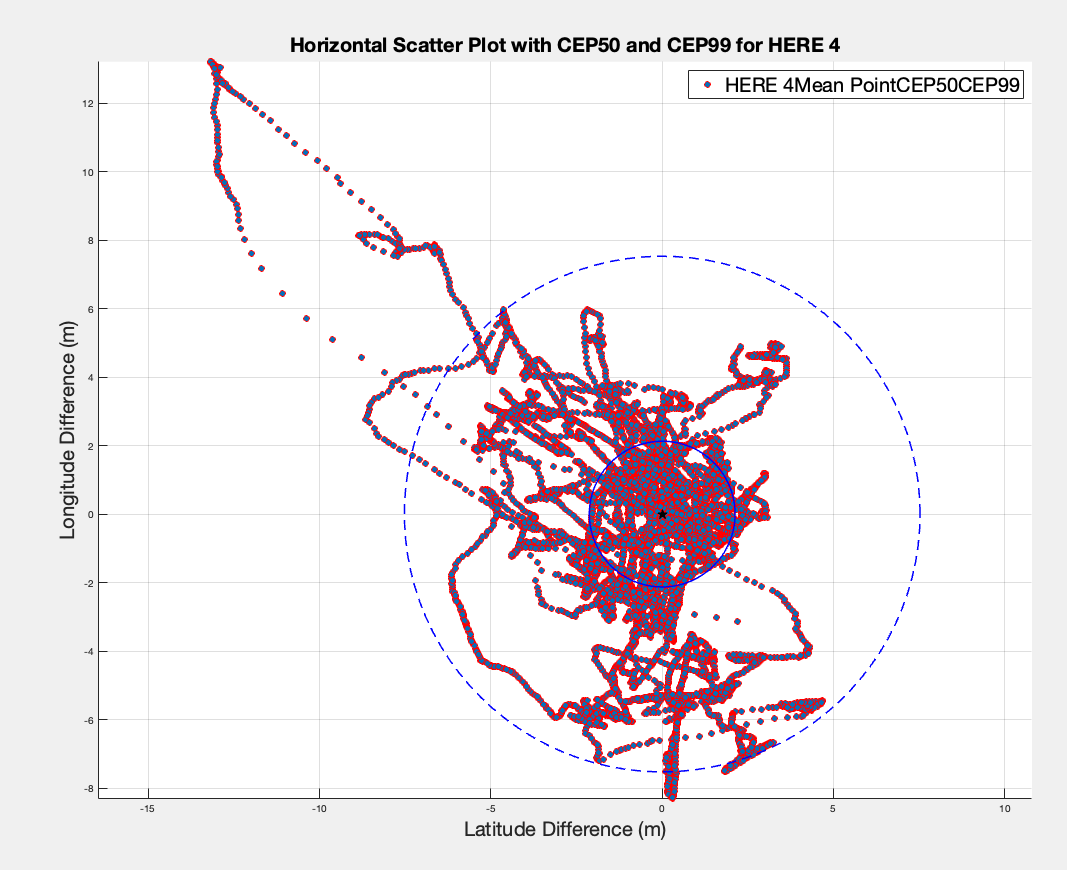
| CEP50 | 2.676 | 0.578 |
| CEP99 | 7.435 | 2.281 |
| HEP50 | 1.594 | 0.391 |
| HEP99 | 5.444 | 1.889 |
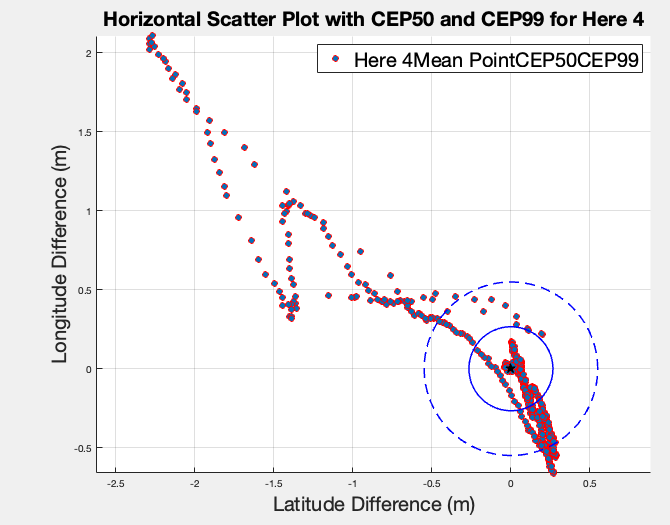
Let us also have another perception of the data here by looking at some graphs:
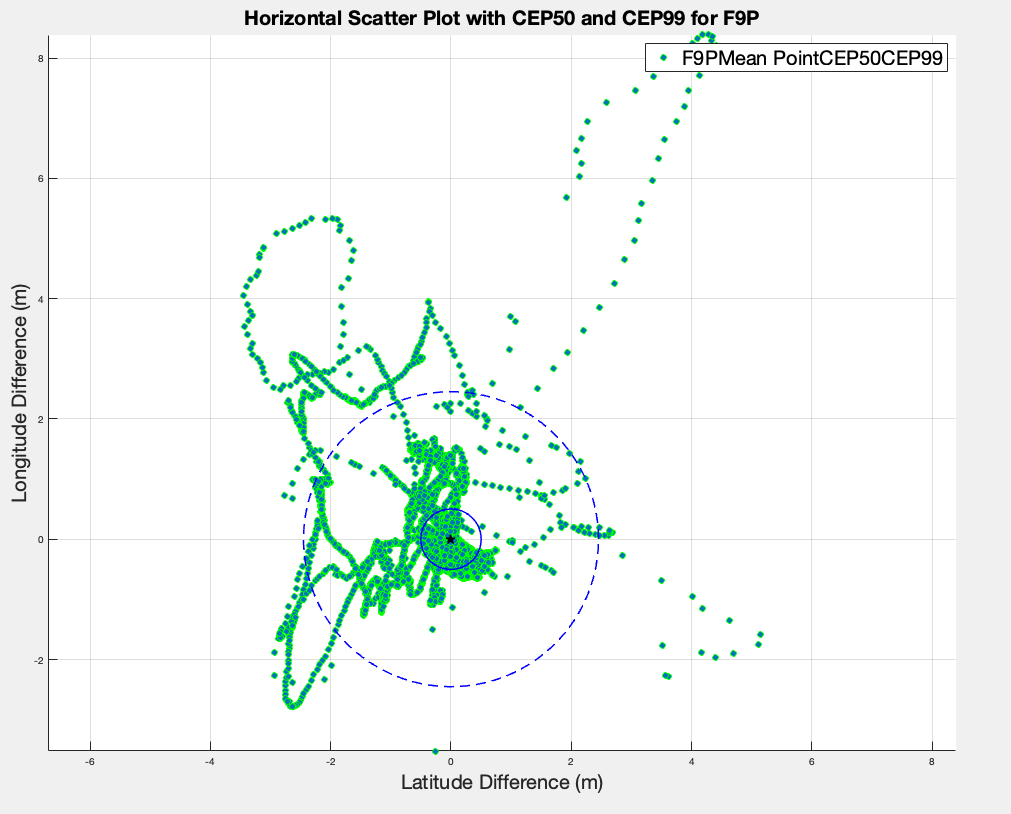
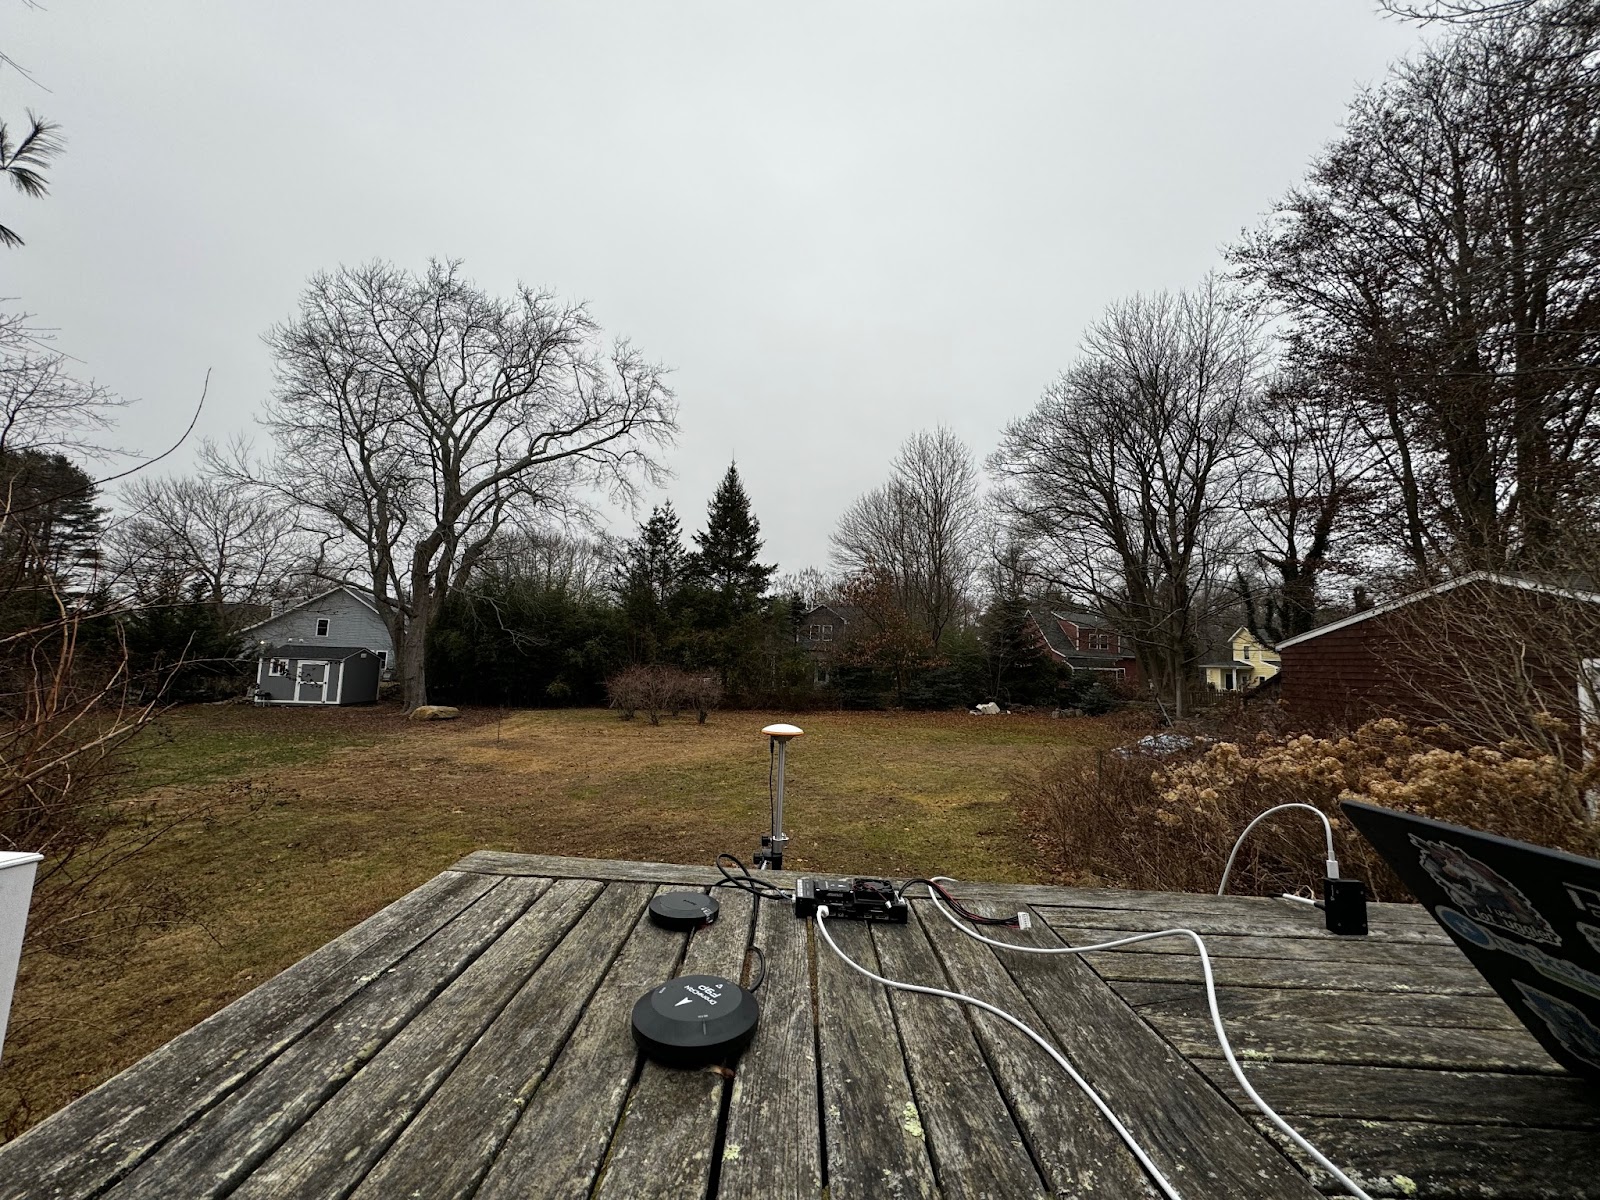
The Second Setup: Open view with RTK (Cloudy Day)
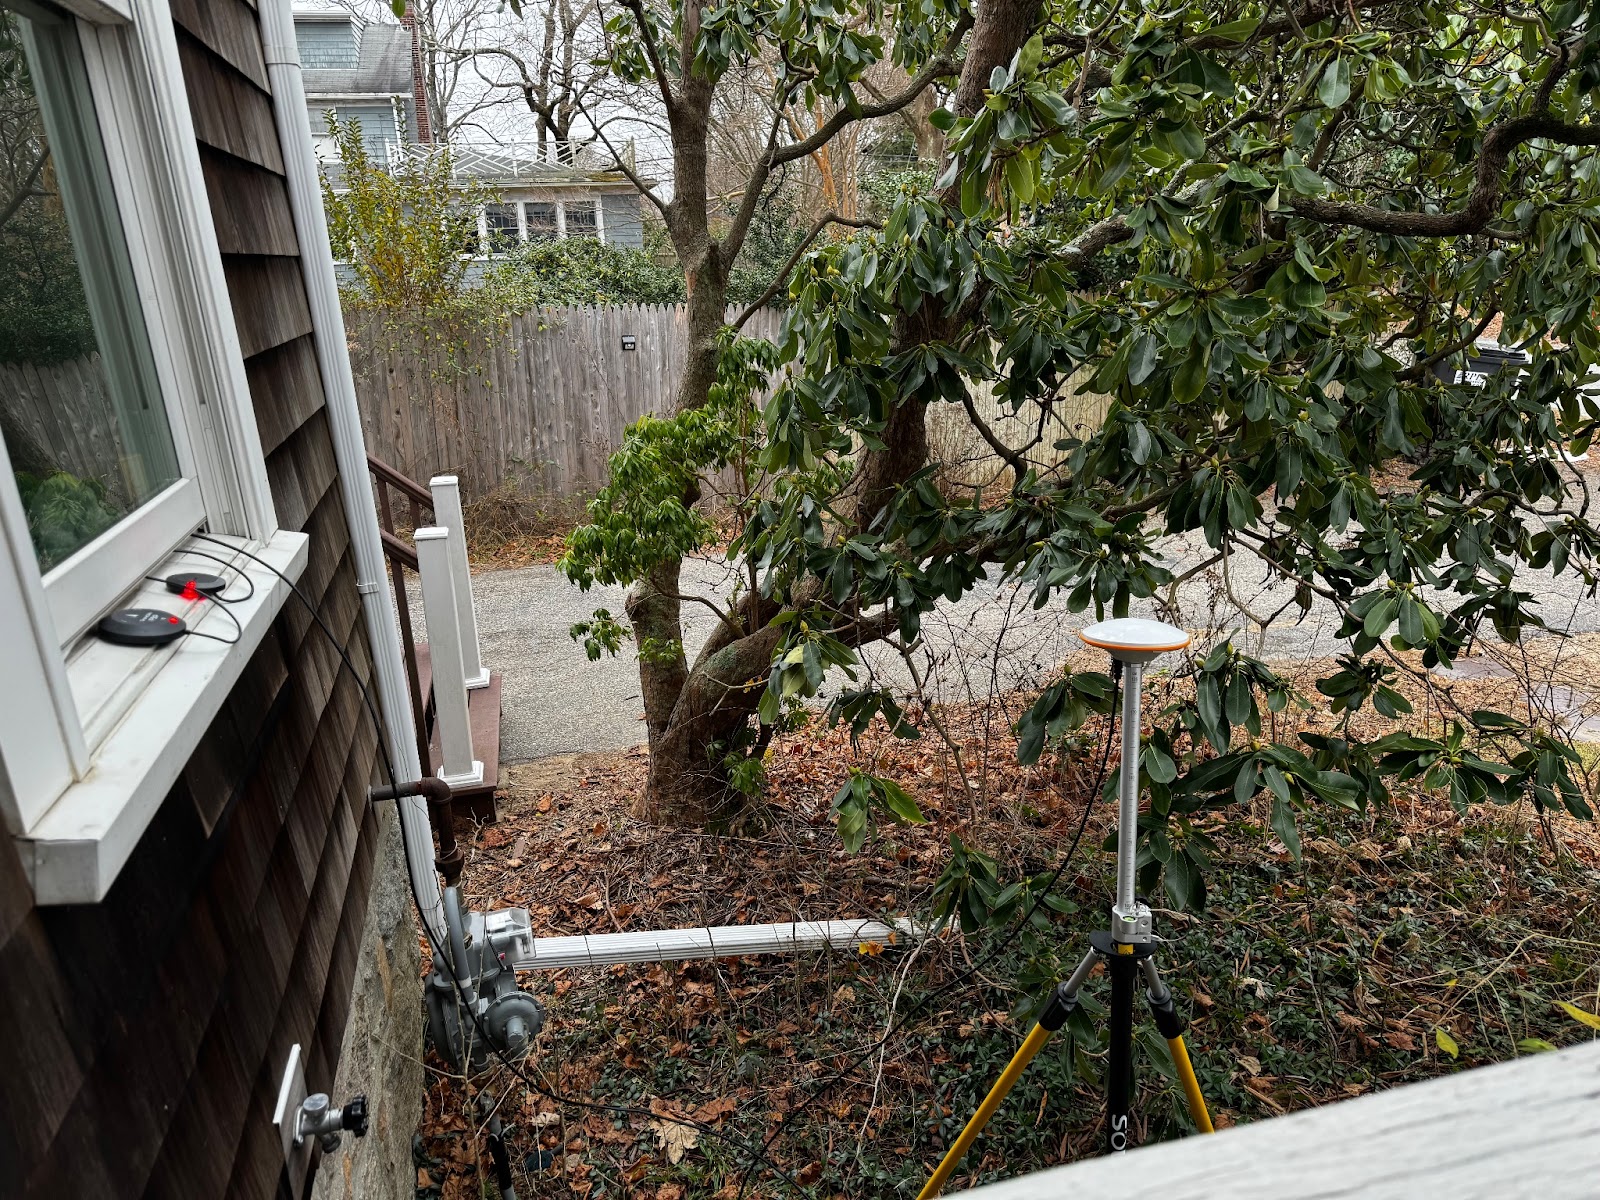
In this setup, I moved everything to the backyard, where there is an open sky with cloudy weather. The photo below shows where I am. The Number of satellites visible here was around 25.
Round-by-Round Results
| Metric | Cubepilot Here4 (Meters)(Float fix type) | Holybro DroneCAN H-RTK F9P (Meters) (Float fix type) |
|---|---|---|
| CEP50 | 0.013 | 0.009 |
| CEP99 | 0.025 | 0.024 |
| HEP50 | 0.125 | 0.063 |
| HEP99 | 0.474 | 0.363 |
Let us take a look at the graphs here. We can observe that the data has a bit of sparsity at the very beginning while the sensors are trying to reach the highest RTK fix type. Besides, it might be better to add that the data mentioned in the above table have been calculated having the lower beginning fix types (non-RTK) not considered.
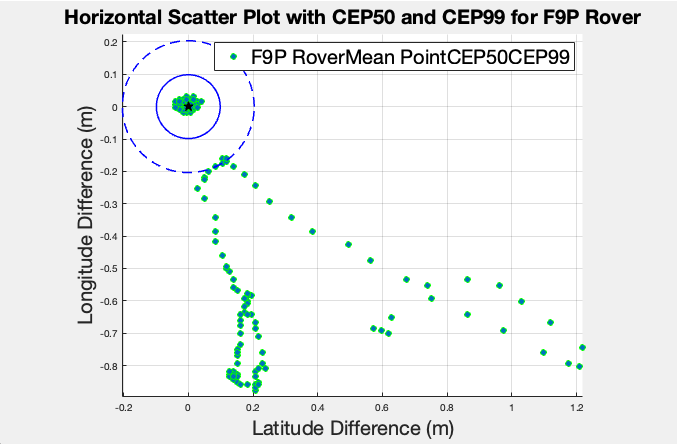
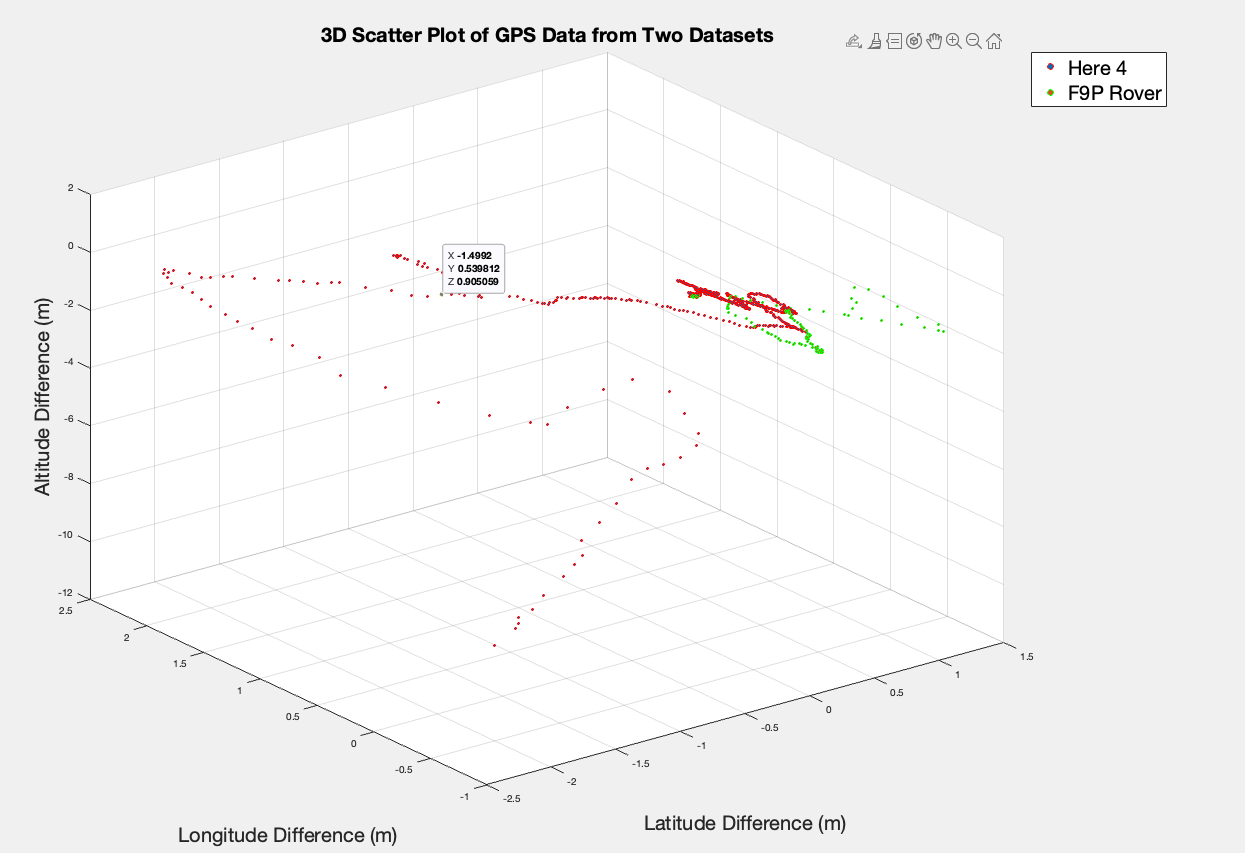
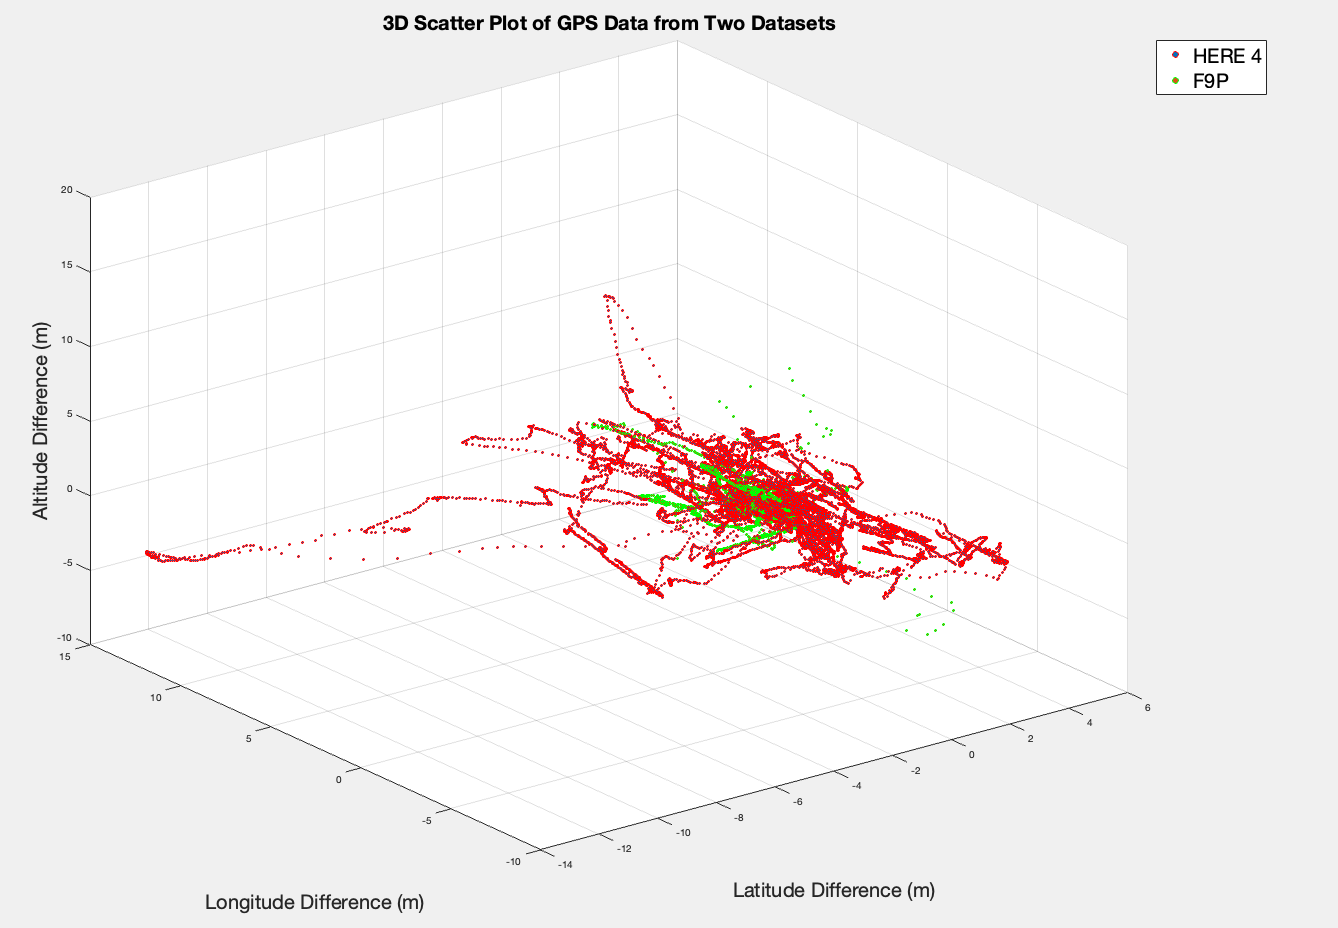
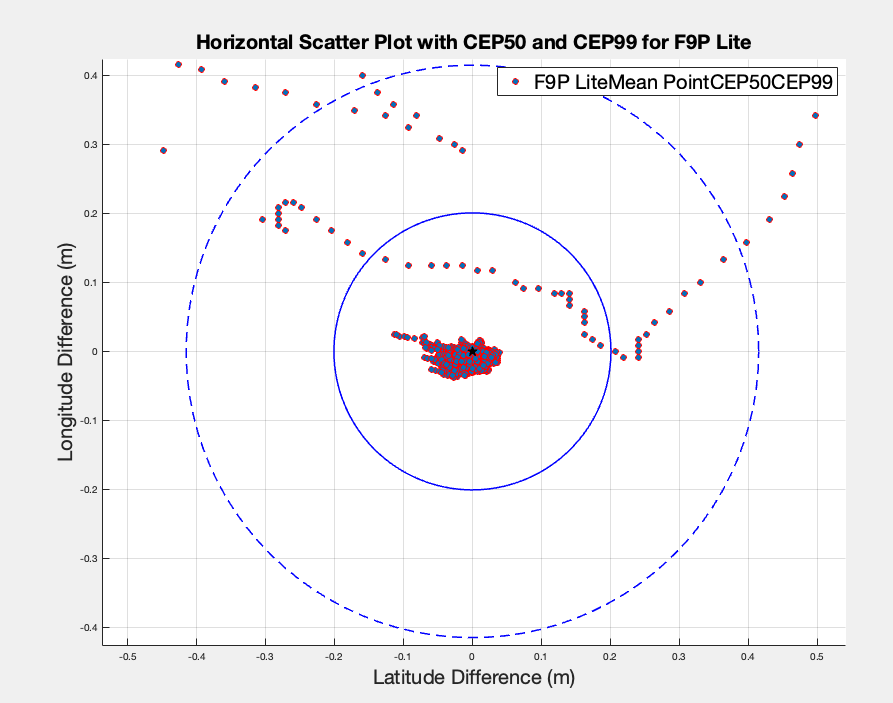
The Third Setup: 4 RTK GPS in Open View (Clear sky)
This time, I went through the same open-sky test with four different RTK GPSs simultaneously. To make the test as consistent as possible, I used two Pixhawk 6X hardwares, one with the Holybro DroneCAN H-RTK F9P with Cubepilot Here4, and the other with the Holybro F9P Ultralite version in addition to the DroneCAN F9P Helical version.
The test location was again the same, and the results were actually interesting to take a look at. This time I did the test on a sunny day with more satellites (approximately 36).
Note: Since I did not have any other Pixhawk 6X in hand at the time of testing this, I had to use a Pixhawk 6X carrier board with a companion computer. For the sake of no interference, only Pixhawk has been powered, and the companion computer is completely powered off.
And the outputs as below:
| Metric | Cubepilot Here4 | Holybro CAN H-RTK F9P | Holybro F9P Ultralite | Holybro CAN F9P Helical |
|---|---|---|---|---|
| CEP50 (Meters) | 0.019 | 0.011 | 0.012 | 0.011 |
| CEP99 (Meters) | 0.029 | 0.031 | 0.036 | 0.027 |
| HEP50 (Meters) | 0.013 | 0.005 | 0.01 | 0.012 |
| HEP99 (Meters) | 0.071 | 0.02 | 0.039 | 0.058 |
| Percent Fixed | 100 | 100 | 100 | 100 |
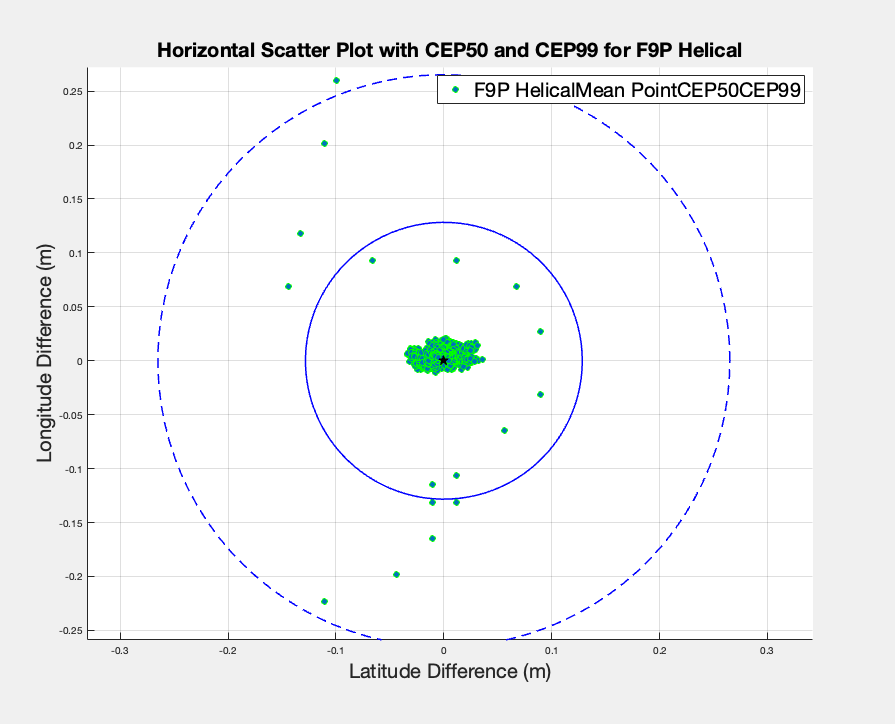
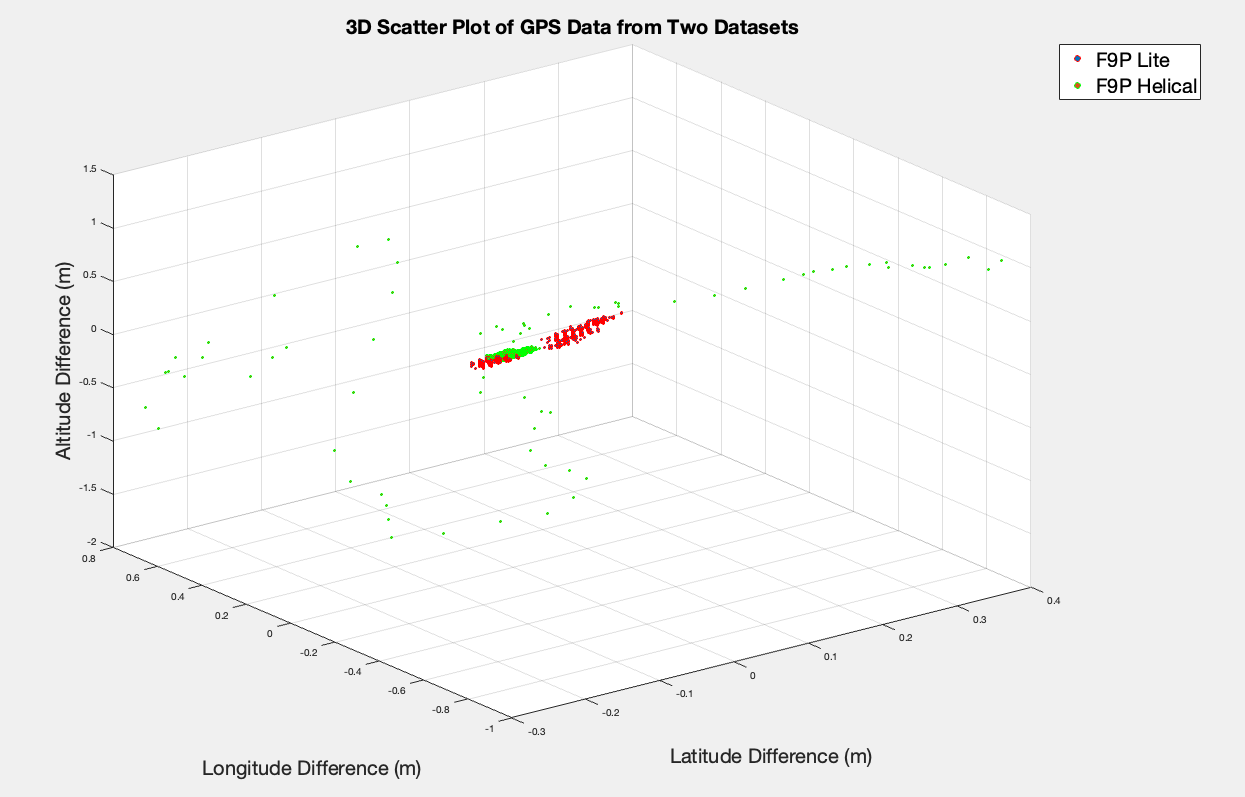
Let us now take a look at the graphs of both F9P Helical and F9P Ultralite versions. You can see the data is more focused around the mean point after we have RTK Fixed.
Final Thoughts
So there you have it! Fantastic GPS modules, each with its own set of superpowers. I fully understand that each hardware has its pros and cons. But on the other hand, in the RTK world each one of the tested hardware has their own acceptable performance as long as they are being fed with the RTCM data. The results were relatively close in open view, and less so in the obstructed environment. Either way, you can’t go wrong with these choices. Happy Navigation!
For further details on these products, please visit Cubepilot Here4 , Holybro DroneCAN F9P, Holybro F9P Ultralight, Holybro F9P Helical .