Thank you Peter,
I will make sure of it.
Hello @Georacer, thank you a lot for all your efforts to develop the matlab library!
It works very well and it is faster and easier compared to the Mission Planner option for Matlab!
I tried to run it to load the values in Matlab from my dataflash log, but I noticed that it only reports a single GPS value while I’m using two GPS modules connected to GPS1 and GPS2. I can see both these two GPS modules (reported as GPS0 and GPS1) if I load the dataflash log in Mission Planner:
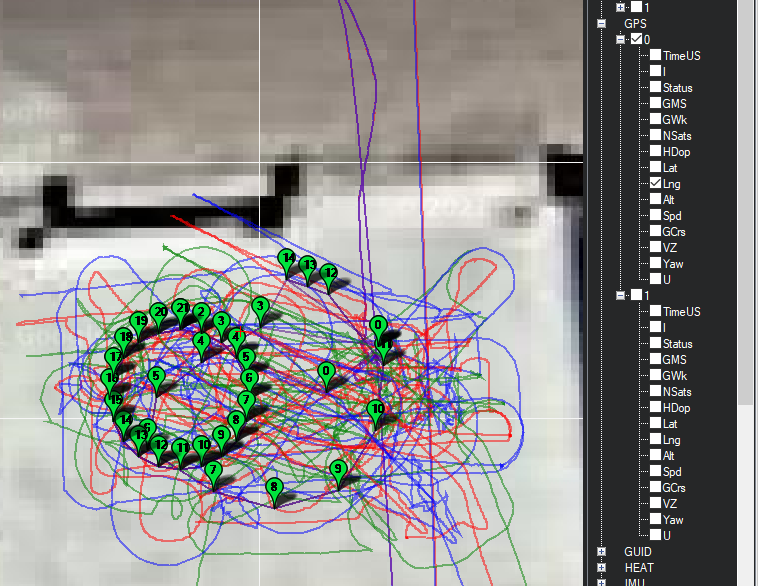
but I cannot see them if I use Ardupilog function.
Moreover, if I generated the mat file from Mission Planner and I import it in matlab, then I get GPS_0 and GPS_1.
Is it a bug or am I missing some important task to do before to run the ardupilog function?
Are you using the latest master version?
yes, I downloaded Ardupilog directly from the github.
Hi, @marcusbarnet! Thank you for the issue report.
I’ve just patched the code, so if you download the fresh master, you’ll now get two GPS fields. log.GPS and log.GPS_1.
I too opt for the zero-indexed numbering scheme. It’s a matter of personal choice, I guess.
1 Like
Hello, @Georacer, thank you for your feedback and your fast reply!
I checked the update and now it works like a charm! Thank you!
Hello,
This is very useful! I do appreciate your work on this.
Has a novice, I do have some questions.
-
Is there a way we can extract the raw data enabling me to process it? I’m building a boat and I would like to be able to extract the accelerometer data in order to process it being able to get a wave size, period and speed (at least an approximate).
-
How can I hold the figures in order to compare data? Pe example I want to see the AHR2 pitch and roll in the same figure.
3.Is there a list to relate the msgName and fieldName for: log.plot(’/’);? At the moment I’m cross-referencing from the MavExplorer software.
Hope you can help me.
I will post my project soon.
All the best,
Pablo
Hello Pablo,
Q3 has entirely to do with how ArduPilot chooses to generate its logged messages and what kind of data it puts inside. It’s not up to me to decide.
But you can get a list of the available messages if you load your log and print it:
>>> log

ans=

         fileName: 'my_log.bin'
     filePathName: '...'
         platform: 'ArduRover'
          version: 'V4.2.0-dev'
           commit: '74fa47a3'
      bootTimeUTC: '...'
    msgsContained: {1×213 cell}
     totalLogMsgs: 8558052
        msgFilter: []
          numMsgs: 8558052
          STAK_20: [1×1 LogMsgGroup]
           XKF4_1: [1×1 LogMsgGroup]
              XKQ: [1×1 LogMsgGroup]
Each LogMsgGroup object is a list of messages.
Then, by printing this message list you can get its fields
>> log.ATT

ans =

  LogMsgGroup with properties:

           typeNumID: 68
          fieldUnits: [1×1 struct]
    fieldMultipliers: [1×1 struct]
                name: 'ATT'
              LineNo: [269043×1 double]
         MsgInstance: 0
               TimeS: [269043×1 double]
          DatenumUTC: [269043×1 double]
               ErrRP: [269043×1 double]
              ErrYaw: [269043×1 double]
              TimeUS: [269043×1 double]
              DesYaw: [269043×1 double]
                Roll: [269043×1 double]
             DesRoll: [269043×1 double]
                AEKF: [269043×1 double]
               Pitch: [269043×1 double]
                 Yaw: [269043×1 double]
            DesPitch: [269043×1 double]
Now what each of these things mean, it’s up to ArduPilot.
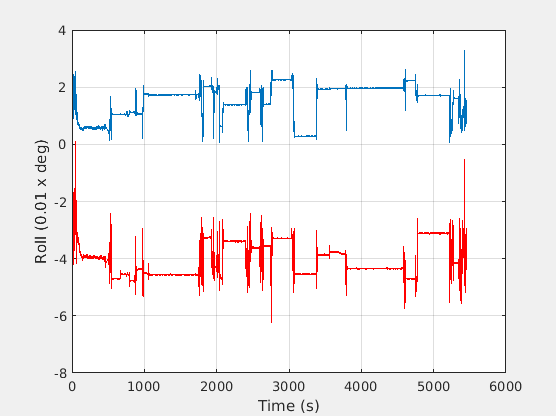
To plot more than one thing at the same time, you can pass the axis handle to the plot command, as follows:
>> ah = log.plot('ATT/Roll');
>> log.plot('ATT/Pitch', 'r', ah);
which gives the following image:
As for your first question, I’m not sure what you refer to when you’re talking about “raw data”. Perhaps you want to get Matlab arrays of data? In that case the log message fields are just that. For example, check your log.ATT.Roll array.
Hello, Thank you for this helpful tool!
I am not sure if it is the right place to ask questions but ill take my chance.
I was wondering if there is a way to plot or show within the plot the flight modes (i.e. Loiter, Stabilize, etc.) from Ardupilog in Matlab. This will be really helpful to slice the data that is required. Could you please guide me a bit?
Hi! I believe that the message MODE and its fields carries the flight mode information.
Ardupilog can’t show the flight modes in the background of plots, e.g. like https://review.px4.io/ does.
But you can use the MODE.Mode timeseries to search which timestamps contain the mode number you want and then slice your data.
If that’s not helpful enough, I’ll try to come up with an example within the week.
Thank you for your immediate response! An example will be really helpful as I am still a beginner at this stuff. Looking forward to it and thank you again!
There are some System Identification scripts in the ardupilot source code that use ardupilog to load .bin files and segment them into flight modes. Take a look at it for inspiration.
Here’s an example:
You first load your log and plot the flight mode:
log = Ardupilog('<path_to_your_log');
log.plot('MODE/Mode');
Make a note of the time instances that you want to work with:
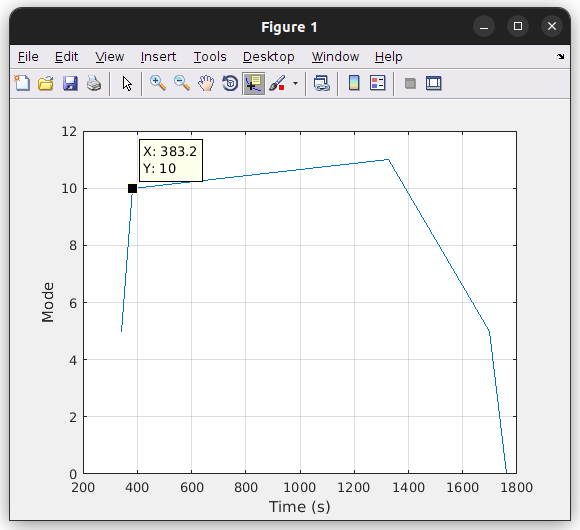

In this case we want to isolate the interval between 383s and 1325s.
Then create your sliced log and plot your data:
sliced_log = log.getSlice([383, 1325], 'TimeS');
sliced_log.plot('GPS/Alt');
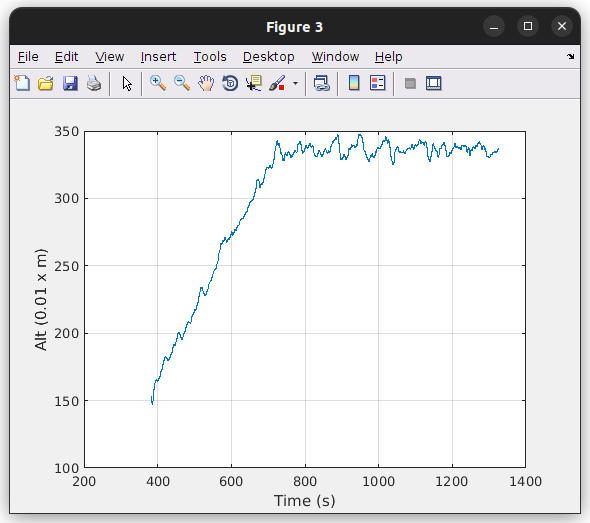
For reference this is what the GPS.Altitude plot would look like:

Thank you for your support!
thanks Mr George Zogopoulos great work ![]()
![]()
![]()
@Georacer - first thank you for providing this tool. It has been helpful to me for several years!
I had a similar question to @Hussein_Hajj_Sleiman on plotting mode changes. Attached are a few files at one way to do this. The attached files are m-files but I saved them as .txt to upload them here.
A use case would be something like:
ht = PlotModeChanges(log.MODE.TimeS, log.MODE.mode, gca)
The getSlice is nice - I hadn’t seen that before.
Cheers.
ArduCopterMode.txt (2.4 KB)
PlotModeChanges.txt (1.3 KB)
CustomDataCursor.txt (837 Bytes)
3 Likes
Thanks a bunch! I’ll take a look at your scripts and report back!
Hi George,
I found your tool with the help of the Ardupilot forum, I’m working on a project and the goal is to “mimic” an acrobatic flight made manually with a RC pilot or with MP+SITL+joystick and reproduce this flight in a “UAV - automatic” flight in Arduplane.
So : Manual RC /Virtual MP flight => Arduplane automatic flight
It seems that Ardupilog can do the job, what kind of MATLAB tools do I need : only MATLAB “Core”? Simulink ? UAV tool ?
I’ve tried MATLAB some months ago with the free trial, but it looks complicated to understand the internal code, do you think a beginner can succeed ?
Many thanks for your answers and help
Nico
ArduPlane has support for scripted acrobatic manouvers.
That will not simulate them (but you probably could in SITL), that will fly them in a real plane.
1 Like
So that’s what I need !