Hello Pablo,
Q3 has entirely to do with how ArduPilot chooses to generate its logged messages and what kind of data it puts inside. It’s not up to me to decide.
But you can get a list of the available messages if you load your log and print it:
>>> log

ans=

         fileName: 'my_log.bin'
     filePathName: '...'
         platform: 'ArduRover'
          version: 'V4.2.0-dev'
           commit: '74fa47a3'
      bootTimeUTC: '...'
    msgsContained: {1×213 cell}
     totalLogMsgs: 8558052
        msgFilter: []
          numMsgs: 8558052
          STAK_20: [1×1 LogMsgGroup]
           XKF4_1: [1×1 LogMsgGroup]
              XKQ: [1×1 LogMsgGroup]
Each LogMsgGroup object is a list of messages.
Then, by printing this message list you can get its fields
>> log.ATT

ans =

  LogMsgGroup with properties:

           typeNumID: 68
          fieldUnits: [1×1 struct]
    fieldMultipliers: [1×1 struct]
                name: 'ATT'
              LineNo: [269043×1 double]
         MsgInstance: 0
               TimeS: [269043×1 double]
          DatenumUTC: [269043×1 double]
               ErrRP: [269043×1 double]
              ErrYaw: [269043×1 double]
              TimeUS: [269043×1 double]
              DesYaw: [269043×1 double]
                Roll: [269043×1 double]
             DesRoll: [269043×1 double]
                AEKF: [269043×1 double]
               Pitch: [269043×1 double]
                 Yaw: [269043×1 double]
            DesPitch: [269043×1 double]
Now what each of these things mean, it’s up to ArduPilot.
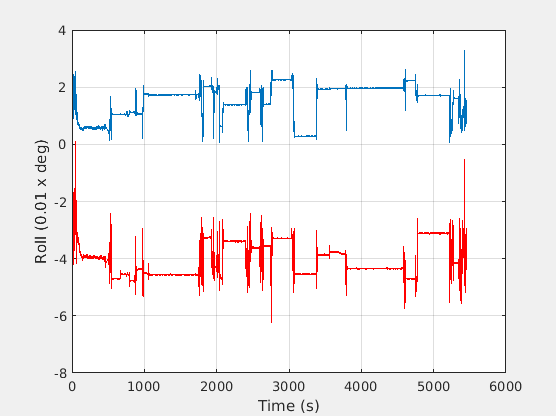
To plot more than one thing at the same time, you can pass the axis handle to the plot command, as follows:
>> ah = log.plot('ATT/Roll');
>> log.plot('ATT/Pitch', 'r', ah);
which gives the following image:
As for your first question, I’m not sure what you refer to when you’re talking about “raw data”. Perhaps you want to get Matlab arrays of data? In that case the log message fields are just that. For example, check your log.ATT.Roll array.