New to Mission Planner and its’ immense graphing capabilities but I cannot tell what’s the Good, the Bad, the Ugly or even how to read some of them. Post some of yours so I can compare.
Here are a couple to start . . . I was trying to view AirSpeed and I’m configured in feet and miles . . . Is the Output axis in MPH?
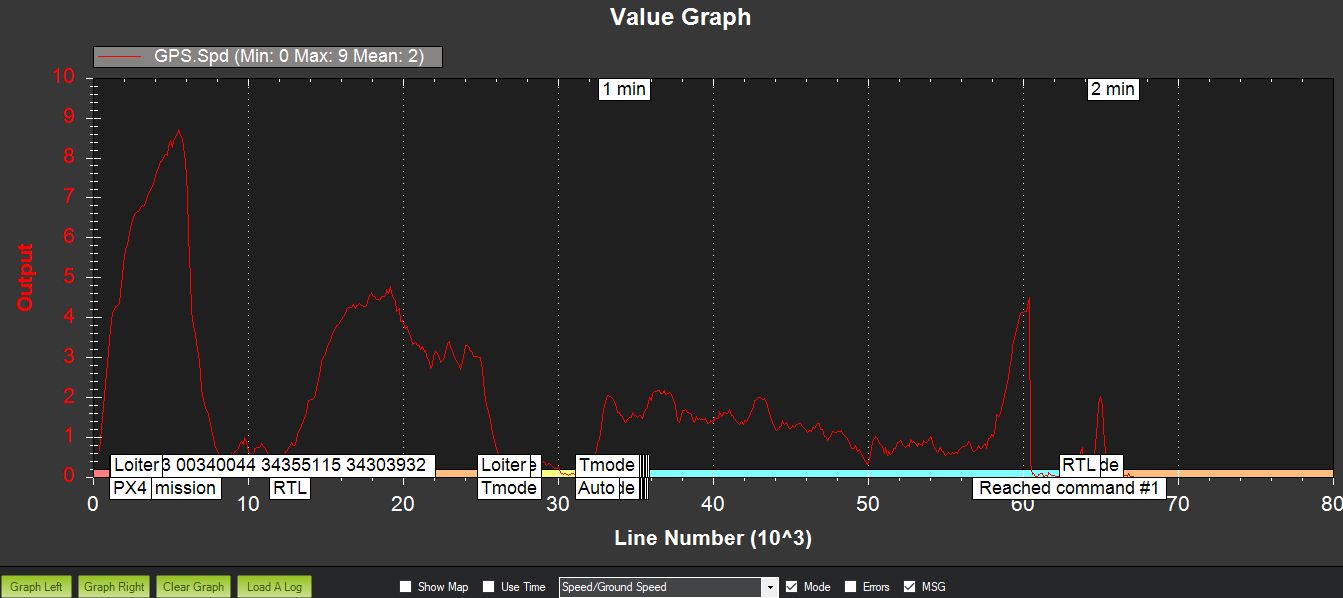
You are guaranteed not to see any imperial mess there.
That one is m/s.