So I looked at these logs and my output shows these being consistent.
In the 13 logs I get:
X a peak at 51 Hz and 105 Hz
Y a peak at 112 Hz
Z a peak at 76 Hz
In the 14 log there seems to be only the 100 Hz noise and it is generally at a lower value. The background noise seems much less.
So I think there is a post processing problem with the results you are showing here and not a logging problem. I have not seen any dropped samples so I am not sure why your results are not consistent. Mine have been been consistent from imu to imu.
@Leonardthall I hadn’t even done the Fourier analysis. I was just looking at the raw time history dara. When I look at instrumentation data, I realize that the time interval between samples will not be exactly constant down to the microsecond but I expect that it doesn’t vary by more than a percent or two of the sample rate.
So I don’t think that I am using a high speed SD card. Did 3DR typically ship their Pixhawk twith high speed SD cards? I probably doubt it.
Very interesting results, BTW they are matching much better to the actual prop speeds. Could you describe your workflow for processing? I just relied on mavfft.py (part of pymavlink), limited to one second of log data that I considered complete and undisturbed. Maybe this approach is a bit too naive.
Regarding SD card: I think the card I used was the original one supplied with the Pixhawk 2.1 (8GB Kingston). I did two more flights today with a different card (SanDisk Extreme), but logs are still to be looked on.
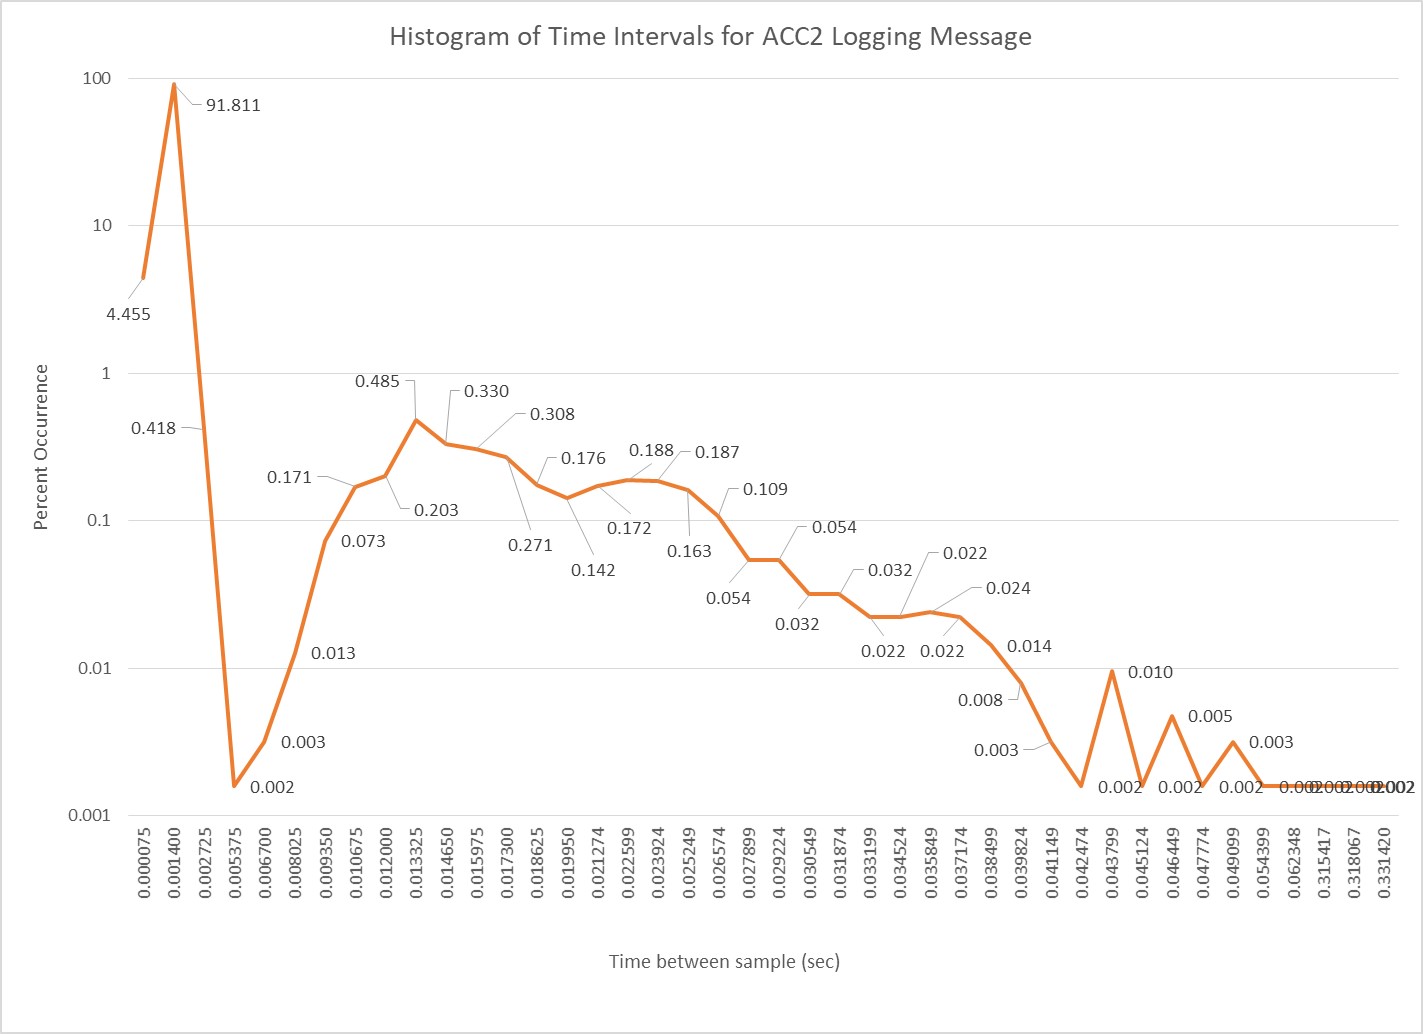
@Leonardthall Here is a histogram of the time intervals between samples for Holger’s first log file. This is for the ACC2 message for a time span of 100 seconds. I used the time tag on this message to determine the time intervals between samples.
Is this typical for logged data. 8 percent of the data was logged at a rate other than the primary sample rate of ~700 hz. 4 percent was at time intervals equivalent to a sample rate of 13000 hz with the other 4 percent at time intervals equivalent to rates from 300 hz to 3 hz. I’m not sure how this would affect frequency analysis since FFT algorthm’s typically expect data at constant intervals. @Leonardthall I would be interested in a log file from your aircraft with raw logging on so I could see the histogram of time intervals.
Ok, I have to eat a big serve of humble pie. I didn’t look properly before I spoke. I apologise!!
I had a closer look at the logs (as opposed to not seeing the same issue you saw and assuming it wasn’t my initial theory of dropped samples then not checking further).
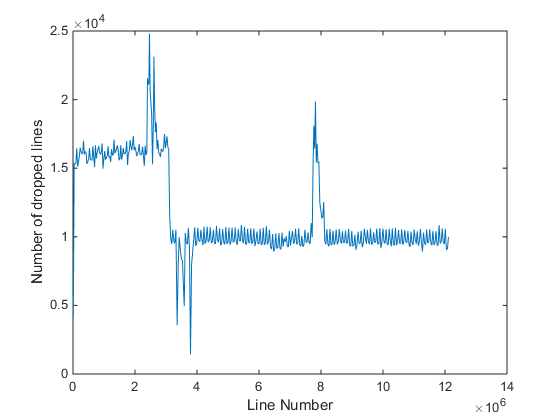
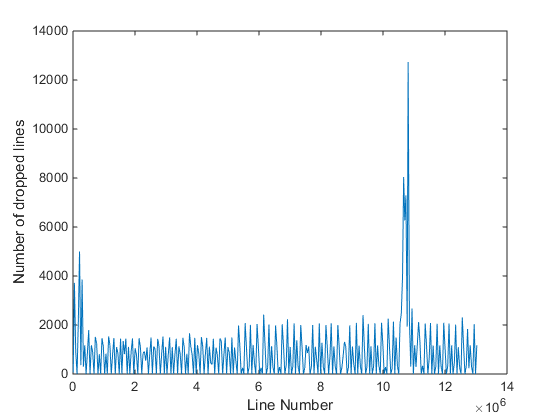
The PM - LogDrop logs show tens of thousands of dropped log entries. This is a classic slow SD card issue. If you are doing RAW logging you need the fastest card you can buy.
There are less logs dropped in the 14 log and that is probably why the graphs look cleaner with a lower noise floor. I apologise again for rushing my analysis and doing some sloppy work here!
PM-LogDrop is the message in the data flash logs that lets us know how many messages have not been written to the log because the SD card can’t handle the rate.
Thanks for the response Leonard. I did figure that out. I never got even the high data rate capable SD cards to work for the 400 hz logging. I took the 25 hz and changed it to a 50 hz for the frequency domain characterization work I was doing. It seemed to be ok with 50 hz but I had to get rid of all of the EKF messages. I would like to get the 400 hz working because i could then see and deal with any aliasing that may be occurring. I’ll probably get back to that after we finish up the spool logic stuff
Chibios will make this much more reliable. We also have some other logging capabilities in the pipeline associated with the FFT stuff that may help us further there too.
@peterbarker Does the batch sampling only apply to IMU log messages? The work that I’m doing with frequency domain characterization requires the inputs (control positions) and outputs (aircraft states) to be sampled at the same frequency. So this captures the outputs but I would need the RATE and ATT messages to be sampled at that frequency was well.
After reading this thread, I wanted to dig a little in the code to see where and how the notch filter is applied to the IMU data. After searching in the library AP_InertialSensor, I realized that the notch filter is only applied on the primary gyro. Is there a particular reason it’ s not applied on accelerometer data (or maybe I missed something) ?
This is because it is only used in the rate loops. The only loop that uses the accelerometer is the Alt Hold controller. I would like to organise these loops differently so that the notch is associated with the PID rather than the sensor but this is a lot of work and we have a way to go before we can do this.
Hi all,
I also tried the notch filter after enabling the IMU batch sampler. I was flying at hovering and at 10-12 m/s so that I can stress the copter to have a representative sample. Here the power spectrum of my copter without filter.
As you may notice the value are very low but there are two peaks at 120 Hz and 230 Hz. The first peak is the most important and I designed a notch filter with bw = 10 Hz, freq = 120 Hz and attenuation of 15 dB (default value). Here how the power spectrum after applying the filter looks like
There is not much difference between unfiltered and filtered data although the filter is quite aggressive. The difference is not remarkable such as that one posted by @hsteinhaus. I admit that my copter already flies smoothly and stably but I was just curious about the feature of the notch filter.
Am I missing something or the filter is just useless for my vibration levels?
Possible things to look into for AC developers?
Add more frequencies since I have 2 peaks that are far apart from each other
Increase maximum centre of frequency (current is 200 Hz)