I’m running a pixracer on a 250 frame with ardupilot 3.6.9. It flies quite ok but I’d like to adjust filtering including notch. So I started batch sampling for FFT. As a result I can see frequencies up to 500Hz. But thought IMUs on pixracer are running at 4kHz so I would expect to see 2kHz in the FFT. Any help is appreciated.
Batch sampling is at 1kHz so 500Hz (nyquist) will be the limit. I have a PixRacer on a 210 (5") frame, I would be interested in seeing your .bin log. I’m using the notch filter and it’s working well.
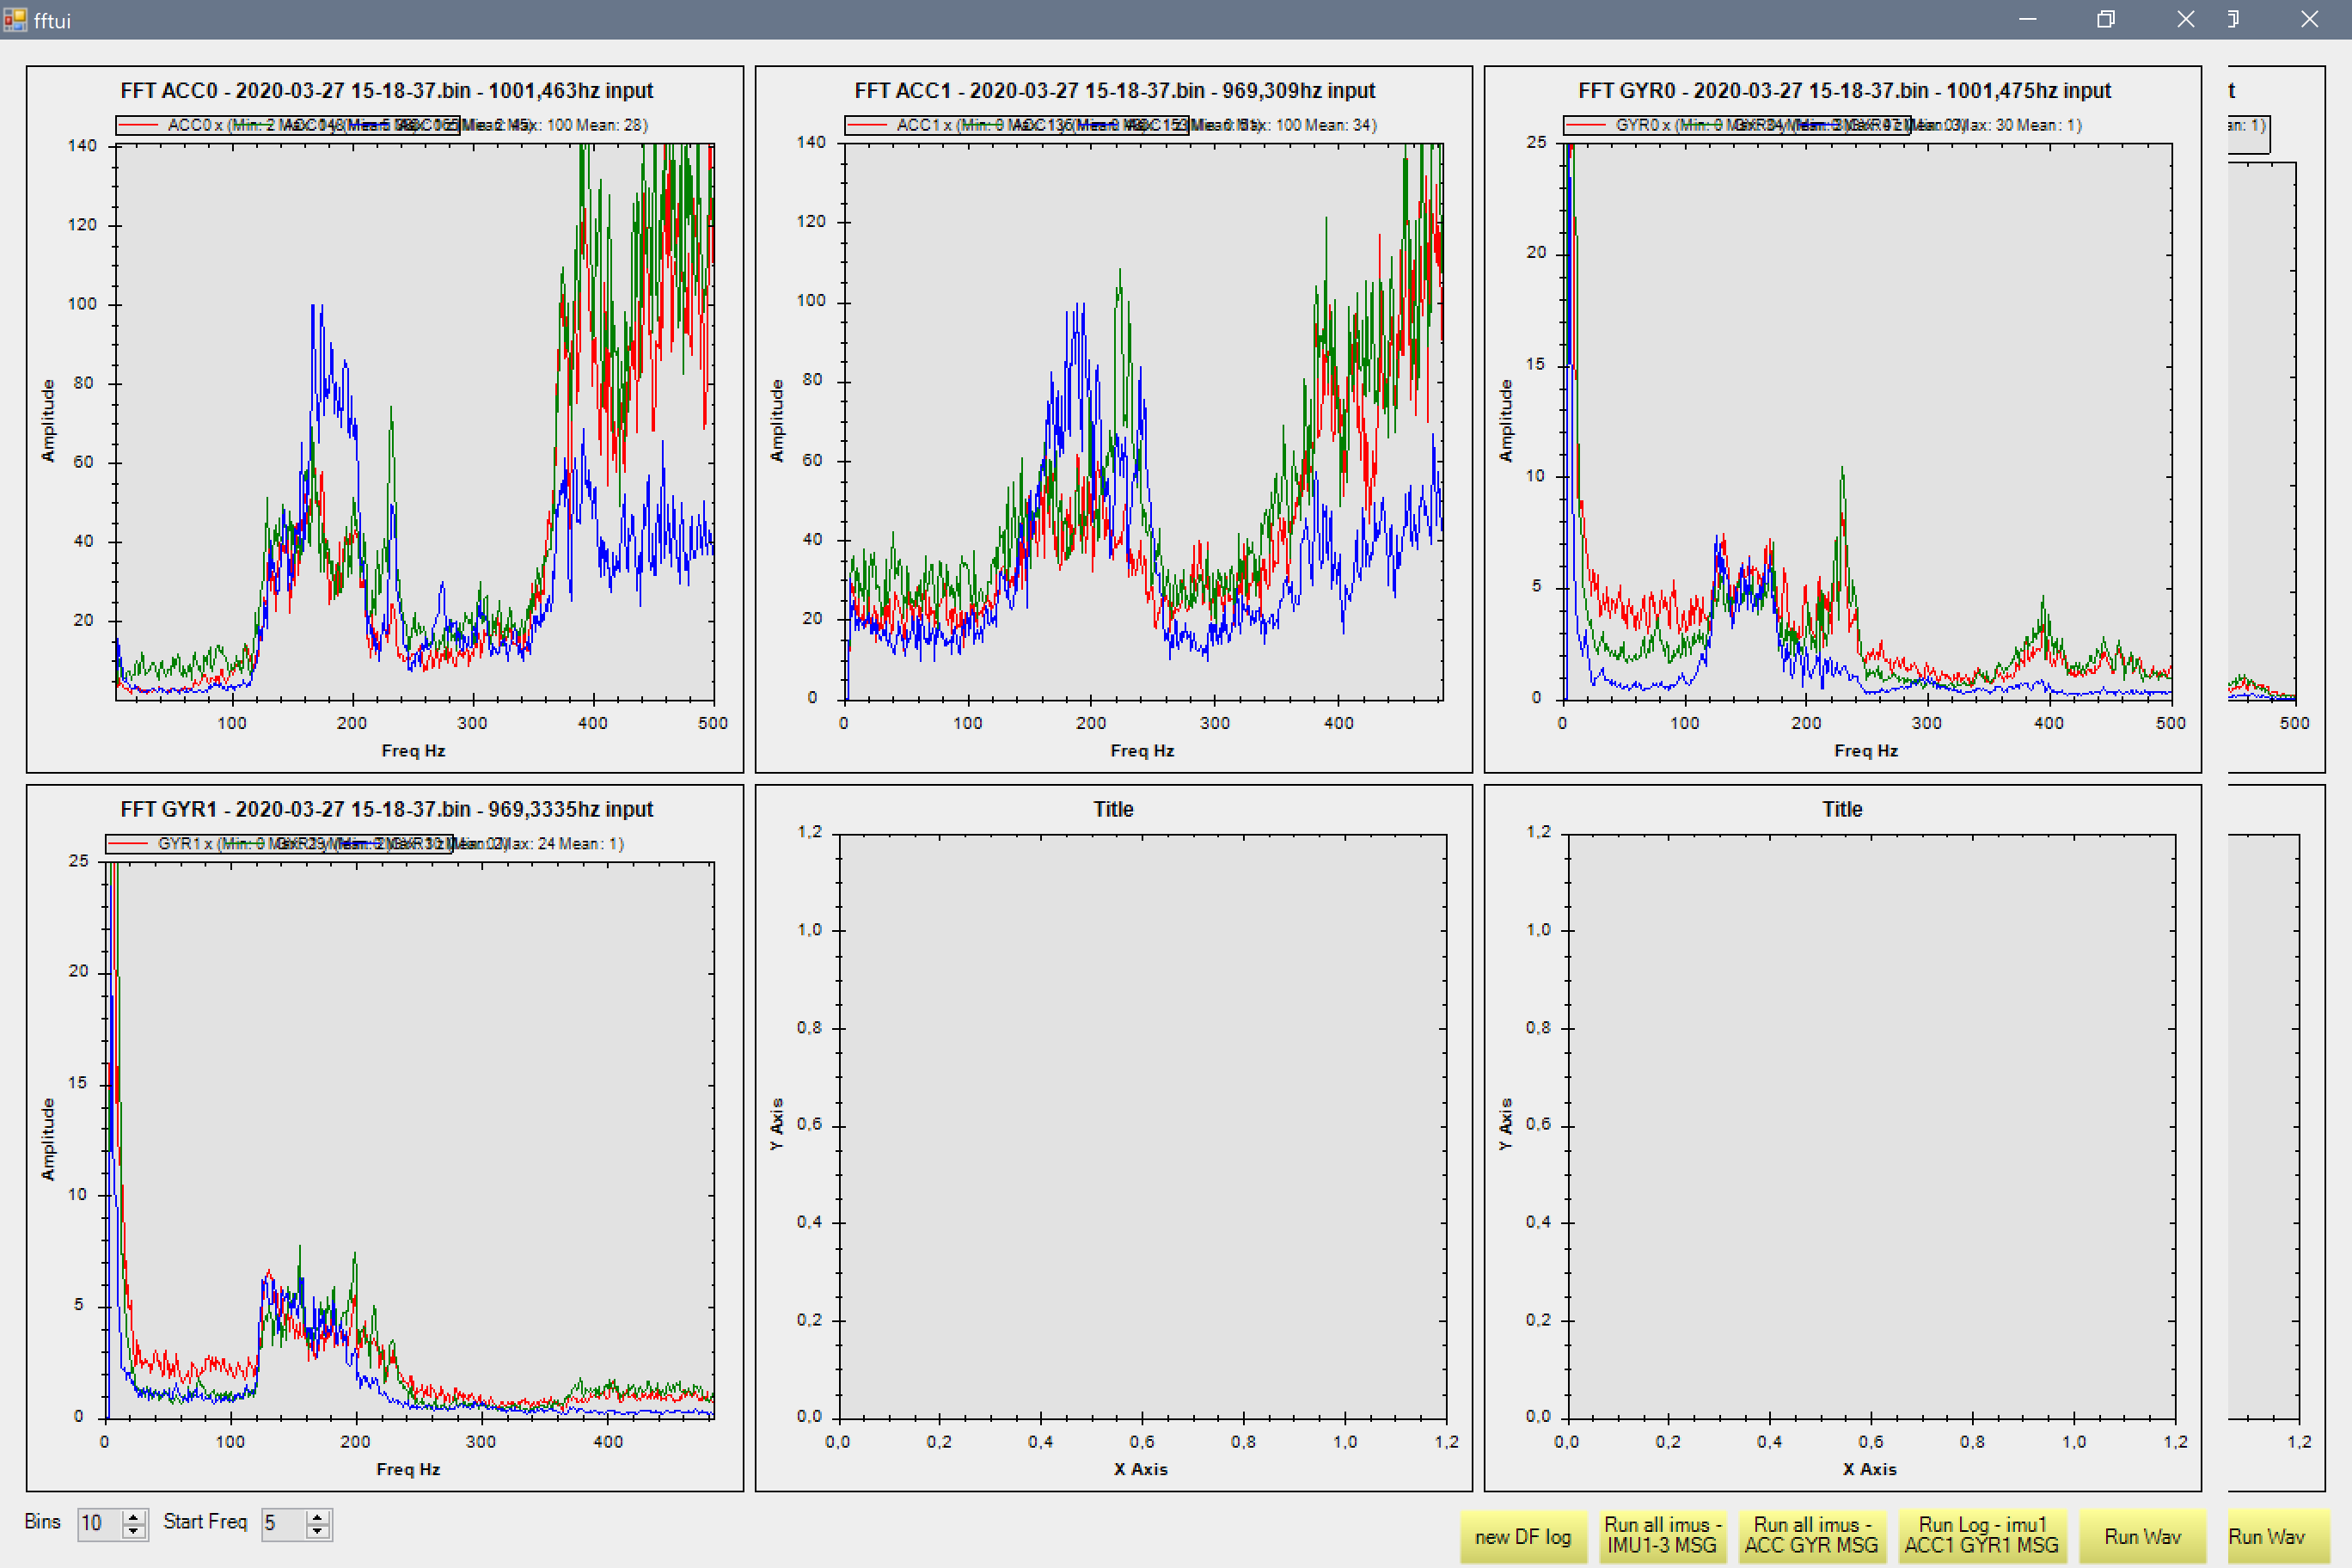
During flight the first peek is around 200Hz, the second starts at 380 and goes on until the end of the axis which is 500Hz. That’s why I would be interested in higher frequencies.
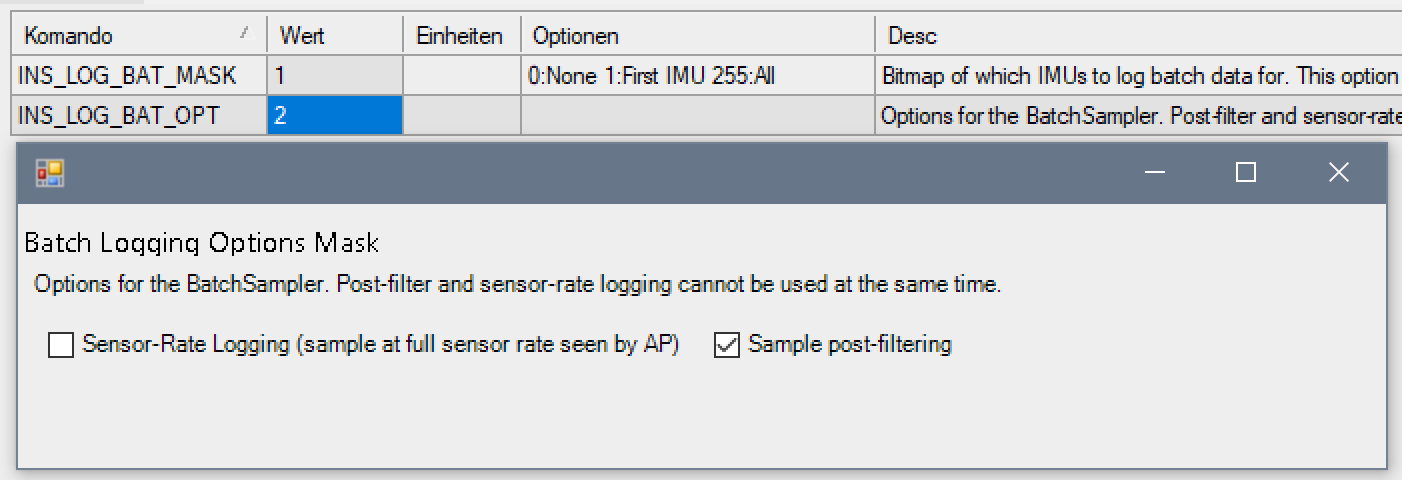
Additionally I wanted to see the filtered signals but I can’t find it in the log. I tried INS_LOG_BAT_OPT without success.
My setup is 4S, weight 630g, 3-blade snails. Do you think it’s comparable?
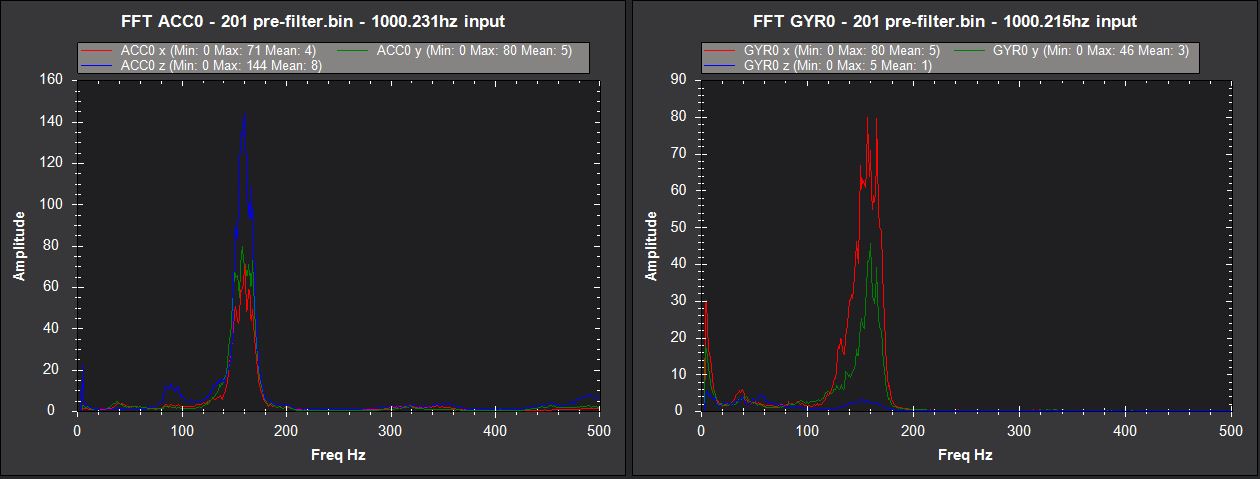
Set INS_BAT_Mask to 1 and INS_LOG_BAT_OPT to zero (be sure to uncheck IMU raw in LOG_BITMASK). Then take pre-filter data.
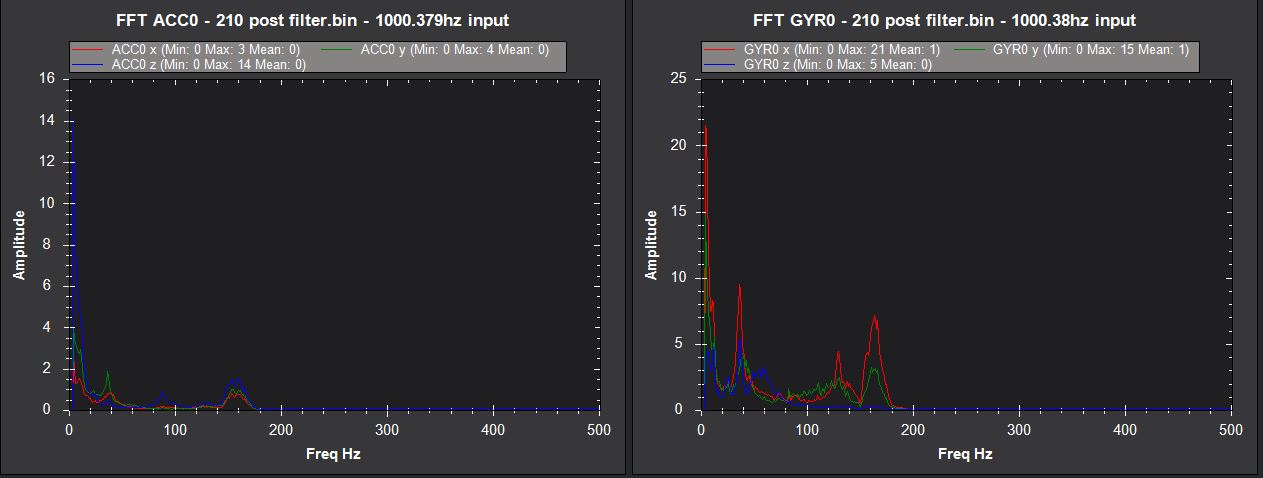
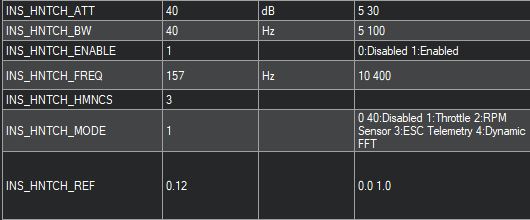
Set your Notch your filter settings and then change INS_BAT_OPT to 2 and take post filter data.
You must have a fairly rigid FC mount. Attached is my pre and post notch filter results. Performance is excellent on this craft:
4S, 550g, 3 blade 5046 props., 2205 2350kv motors
Of course 4.0. It’s 4.0.4-dev on this craft but current stable (4.0.3 today) on others. I didn’t find the static notch to be particularly effective and why not run current stable anyway? The dynamic notch, even throttle based as in this craft, is far superior. If you have ESC telemetry it’s even better.
Looking at direct acceleration isn’t the most useful metric for Vibe analysis. Use the “Vibe” data instead.
I would be interested in seeing your log. You can use Dronee Plotter to randomize the flight GPS coordinates if you are not comfortable sharing that info. It’s what I typically do if I’m flying at home.
I’m wondering where all that high frequency content is coming from on the accels and it’s not coupled with the gyro. I would only enable 1 IMU for this analysis.
As Dave suggested, INS_LOG_BAT_OPT 2 is for logging post filtered data and its working for me. You can double check making a similar flight time with INS_LOG_BAT_OPT 0 and you might see the same noise scenario, without the GYRO FILT (its a low pass filt) and the notch filtering if you are using it. In general in my quad the final “picture” at a first look is similar, but if you look at the vertical axes, the values where the peaks stands are much lower in the post filtering (for example 100 before filtering and 10 in the post filtered graph)