Is there a way to easily show the distance from the takeoff point in the BIN dataflash logs? Ideally, the “slant” distance - although I can make do with the horizontal distance.
I’ve been plotting RSSI for new antenna - and I’d like to be able to relate it to the distance from the transmitter.
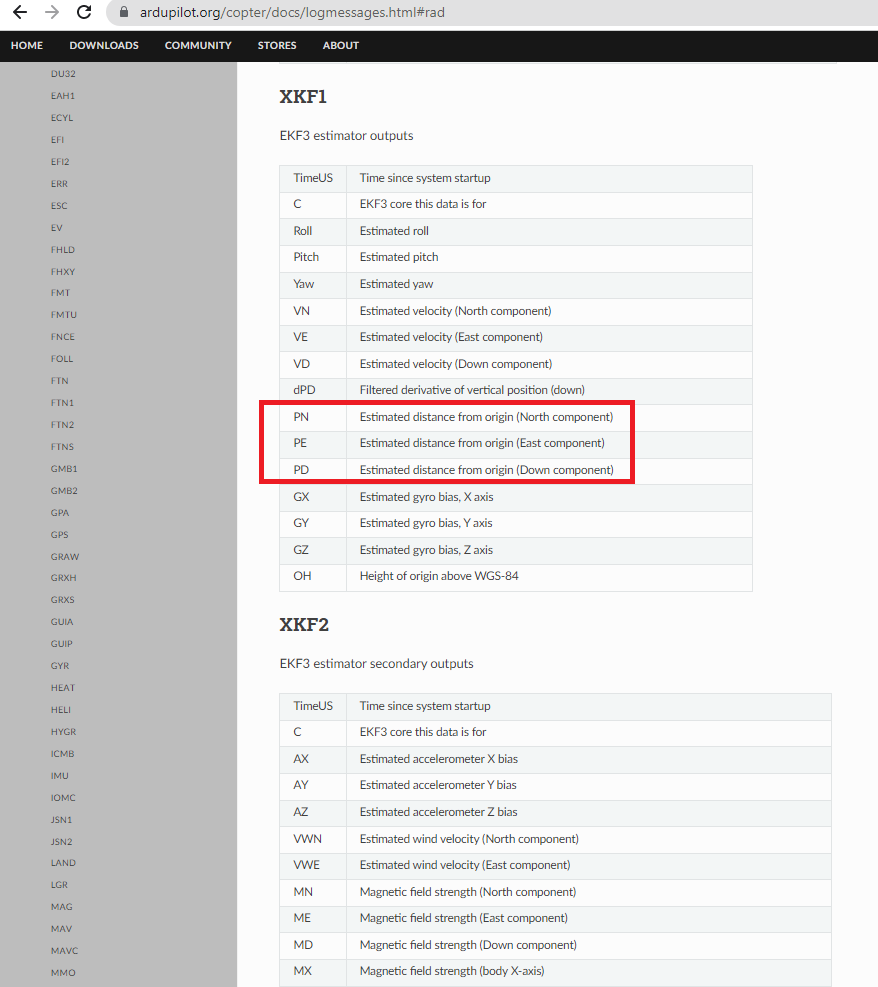
I’ve seen parameters that contain the relative altitude above home - but not the distance. I’m guessing it’s there - I just haven’t been able to find it yet.
To do this I’d have to export the data values - and process them outside Mission Planner - unless there are more tricks I haven’t learned… I haven’t had the pleasure of exporting data series out of BIN files yet.
I had noticed the North and East values - and wondered why they were reported. I’m guessing it’s just easy to compare the longitude and latitude of each recorded point on the flight path with longitude and latitude of the home point.
While it would take some processing power to compute distance real time, having it available via MavLink would be a real advantage on the ground control station. Distance from home is pretty ubiquitous - everything from DJI to Betaflight has it.
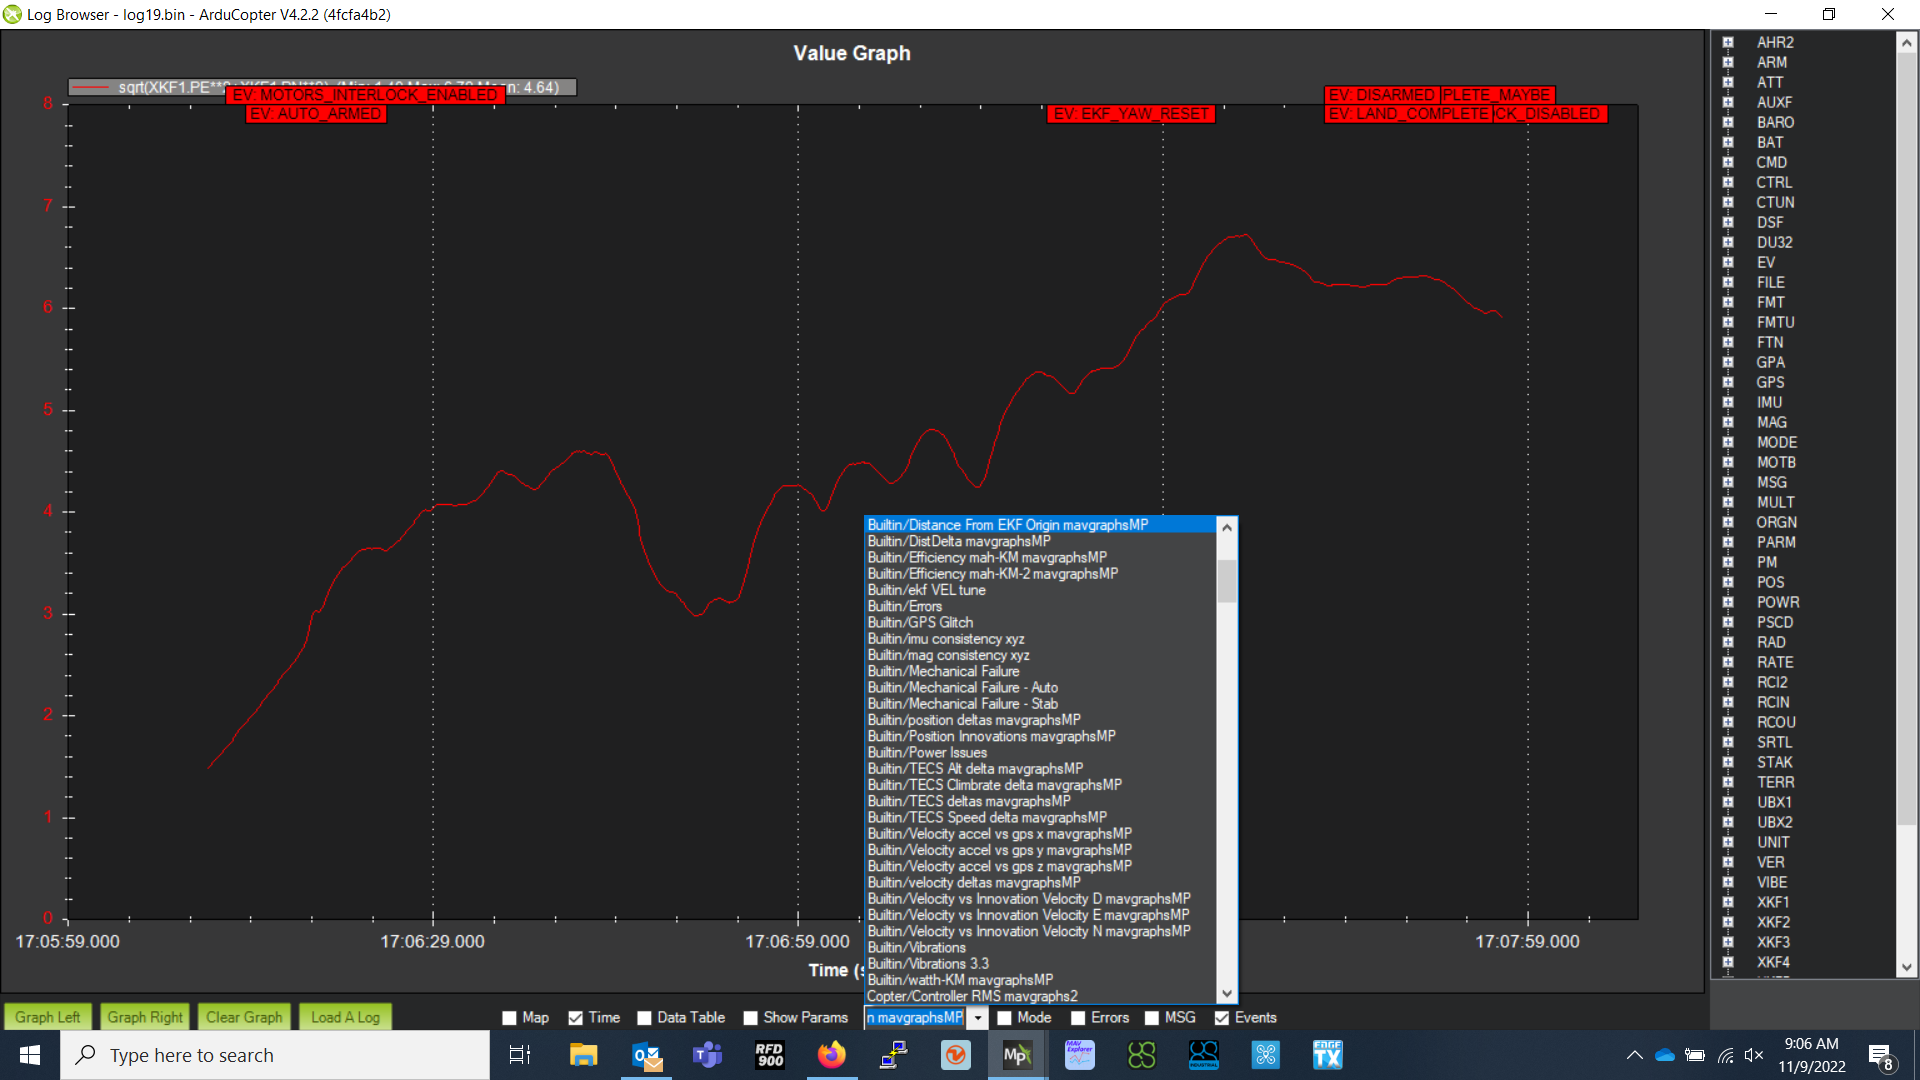
If you’re using Mission Planner the math is done for you already in the MavGraphs.
Bulletin/Distance from EKF Origin MavGraph
Real time: If you’re using Yaapu Telemetry, it’s displayed right on the screen of your radio. Mission Planner and QGC will also display it on their flight maps.
Nice - I’ve always wondered where some of the non-standard MavExplorer graphs came from.
OK - now more to figure out.
Assuming I’m graphing the right data elements - what the heck are the units being displayed?
And then there’s creating a formula. I understand python math functions can be used - but I’ve tried some basic arithmetical operations and got no results. So computing the distance to the origin will still take more work here…
Thanks @Allister for pointing me the right direction. Any more hints would be appreciated.
If I remember my geometry correctly (of course I had to look it up) the distance in 3 dimensions is the square root of the some of the square of the distances in each dimension.
And it seems the units are meters - mission was flown at 60 meters - and that matches the EKF1.PD.
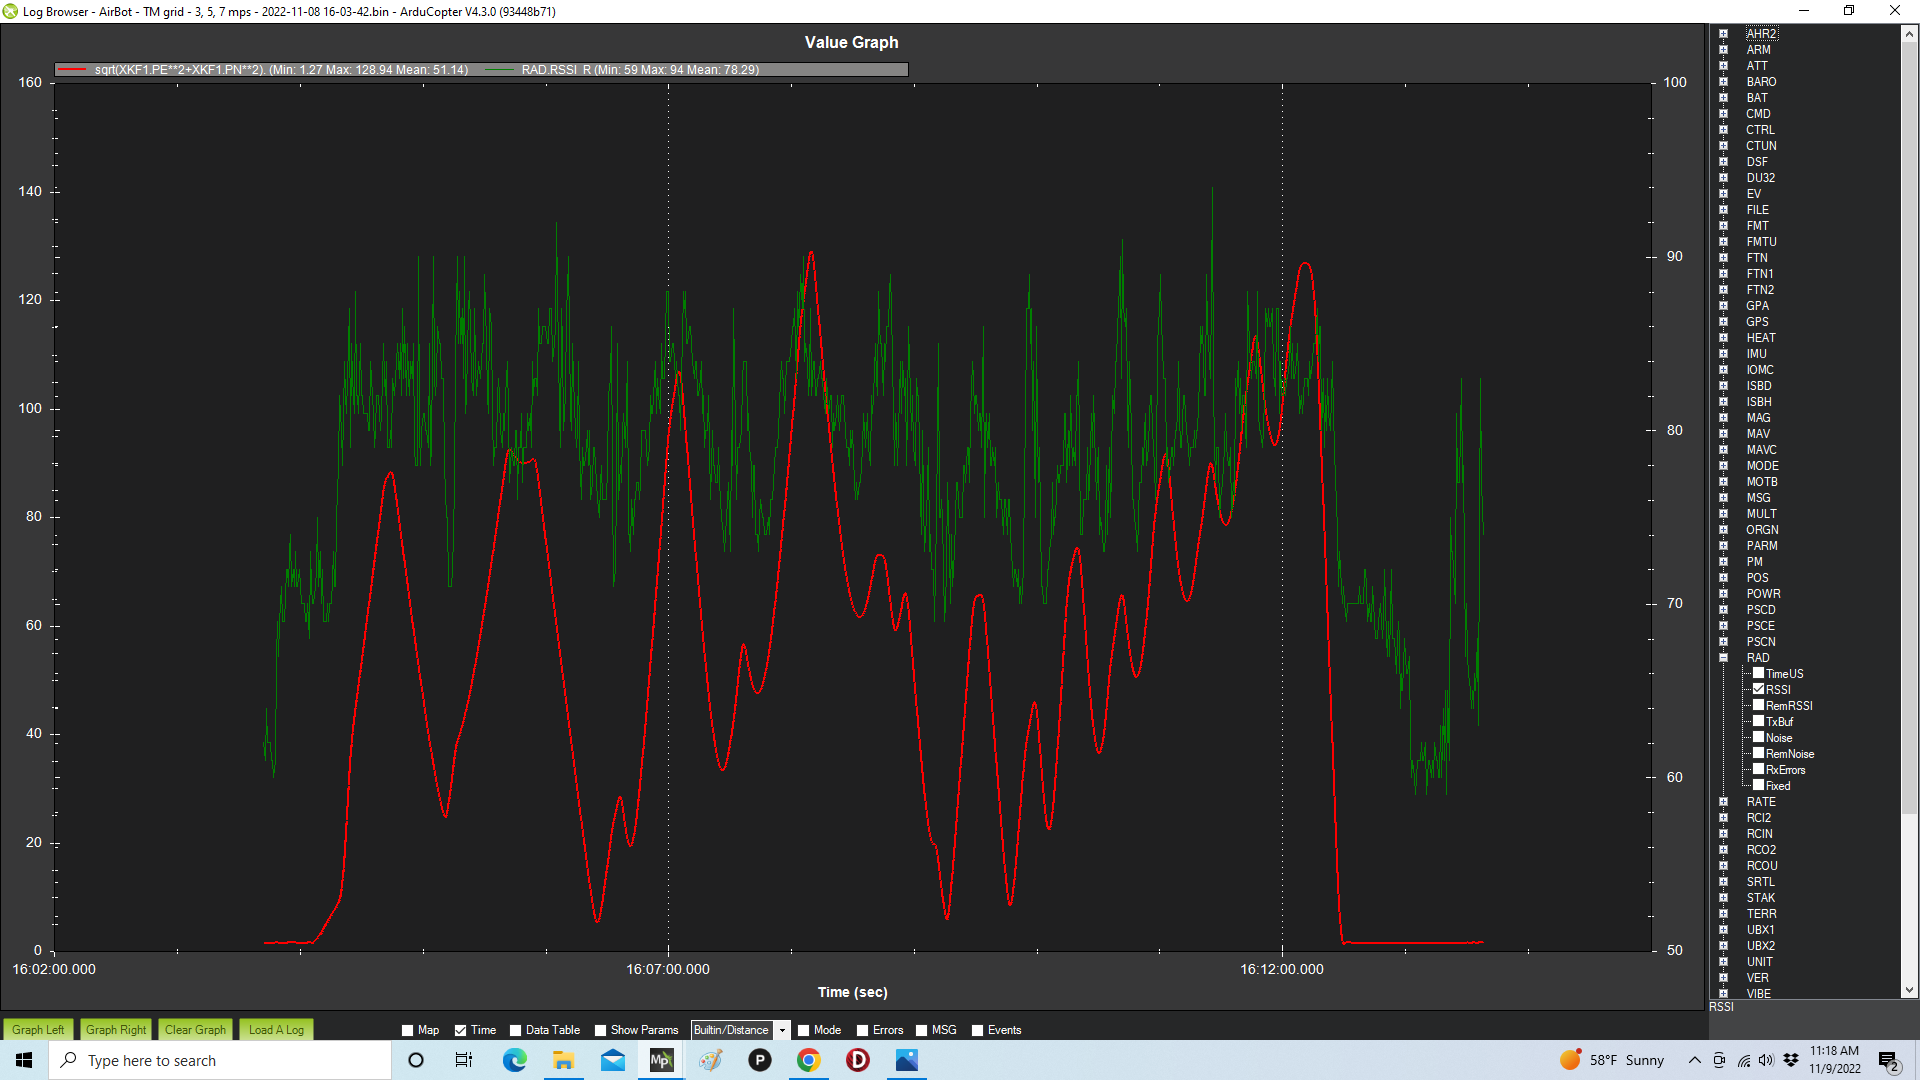
So plotting the distance formula against RSSI made a nice graph - but it’s opposite what I would expect.
I would expect a lower RSSI when the distance is greater.
The graph shows a higher RSSI when the distance is greater.
So either my distance formula is wrong - or the RSSI being reported is wrong.
I never know these function existed. I’m going to have to spend a day studying them.
I just noticed that this function in Mission Planner is only horizontal distance - it excludes the “down” element to compute the “slant” distance. For looking into radio signal strength, I think this “slant” distance is necessary.
I’m curious if there’s a way to add a user defined function.
Here’s the distance vs rssi graph from Mission Planner:
Yeah, RSSI confusing and I’m going to not claim any expertise here. It depends on the radio you’re using as to how it’s reported. And is it reporting RSSI, or LQ or some other variation.
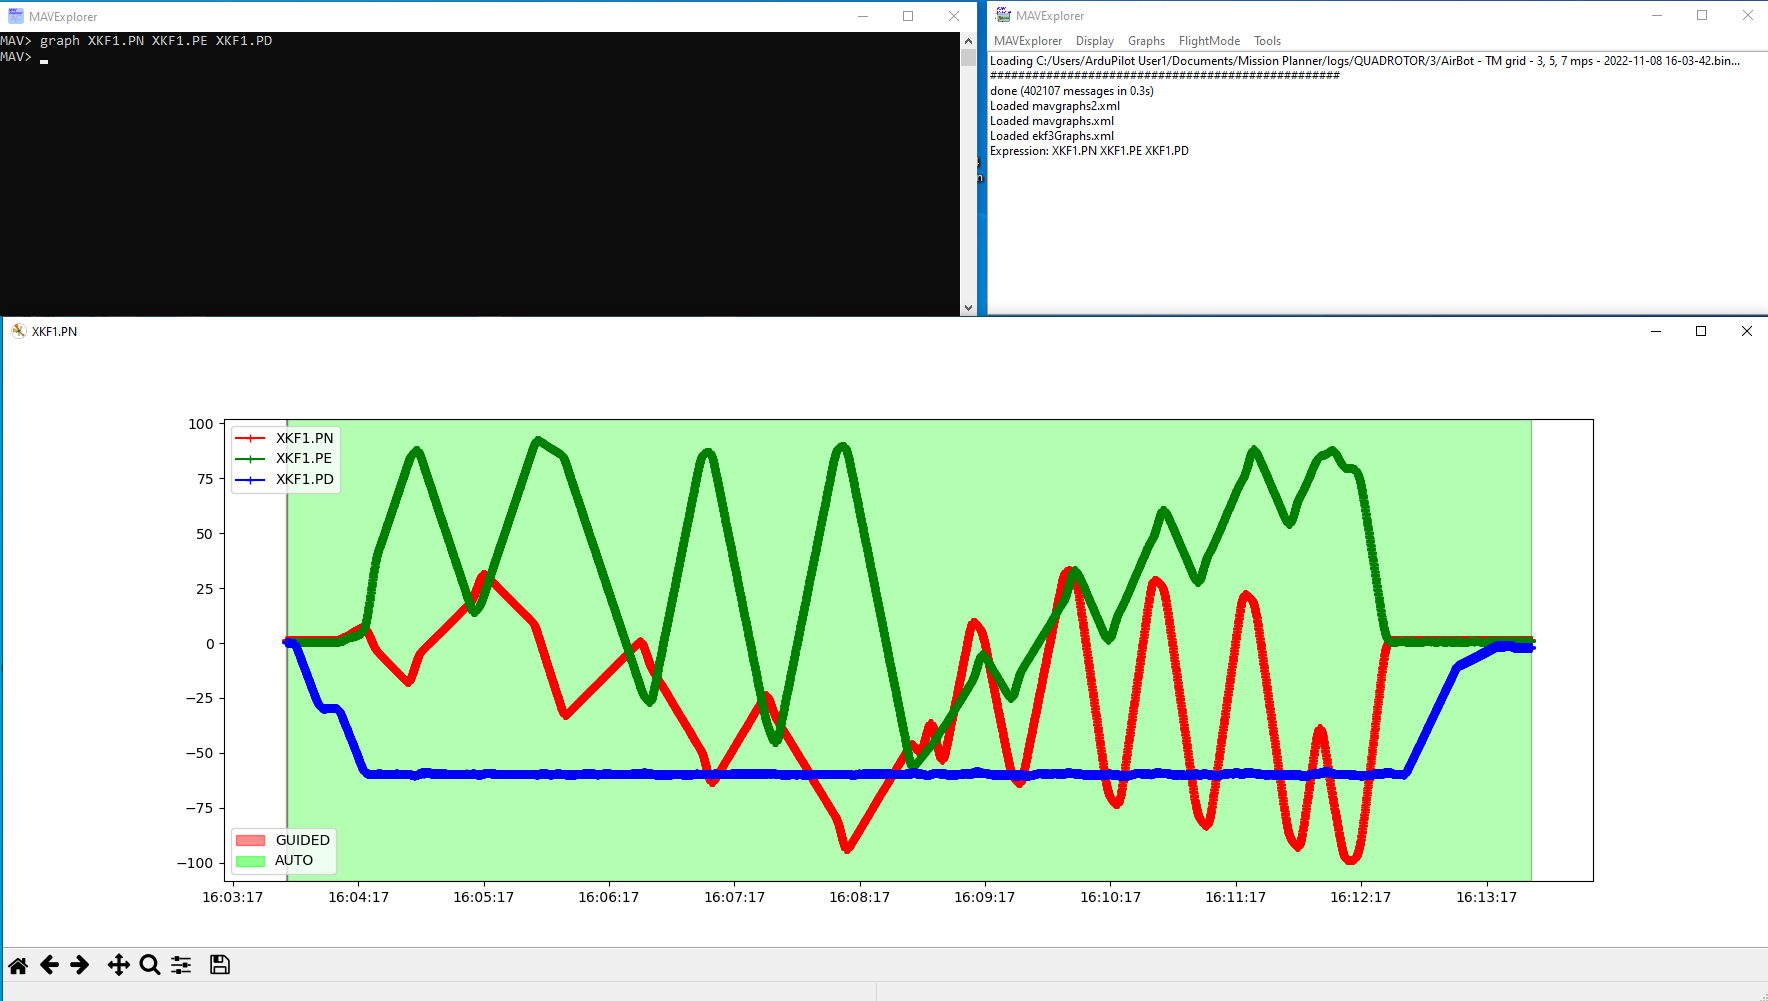
I do most of my graphs in MavExplorer, including custom math. In fact I use MavExplorer more than anything else now for logs.